The Cost of War
Keywords
war-on-disease, 1-percent-treaty, medical-research, public-health, peace-dividend, decentralized-trials, dfda, dih, victory-bonds, health-economics, cost-benefit-analysis, clinical-trials, drug-development, regulatory-reform, military-spending, peace-economics, decentralized-governance, wishocracy, blockchain-governance, impact-investing
Since 1913, your “governments” have printed $170 trillion out of nothing and spent it on murdering 310 million1,2 and destroying many valuable things those humans spent their entire lives building. Consequently, you would be 23.2x (90% CI: 8.4x-64x) richer today from the compound effects of productive instead of destructive spending. They are still going. Current annual budget for organized violence: $2.72 trillion3. Current annual deaths from diseases you could be finding cures for: 55 million4.
The Itemized Receipt for Armageddon
The Shopping List (2024 Global Data)
| Cost Category | Amount (USD Billions) | Per Capita | Daily Cost | How We Counted |
|---|---|---|---|---|
| Military Personnel Salaries | $681.5 | $87.37 | $1.87B | Global armed forces: 28.4M × avg. salary $24,000 (adjusted for inflation)5 |
| Weapons Procurement | $654.3 | $83.88 | $1.79B | SIPRI Arms Transfer Database6 aggregation |
| Operations & Maintenance | $579.8 | $74.33 | $1.59B | NATO standardized O&M ratios × global spending7 |
| Military Infrastructure | $520.4 | $66.72 | $1.43B | Base construction/maintenance × 4,435 major facilities8 |
| Intelligence Operations | $282.0 | $36.15 | $0.77B | Estimated 10.4% of total military budgets9 |
Total Direct Military Spending: $2,718.0 billion
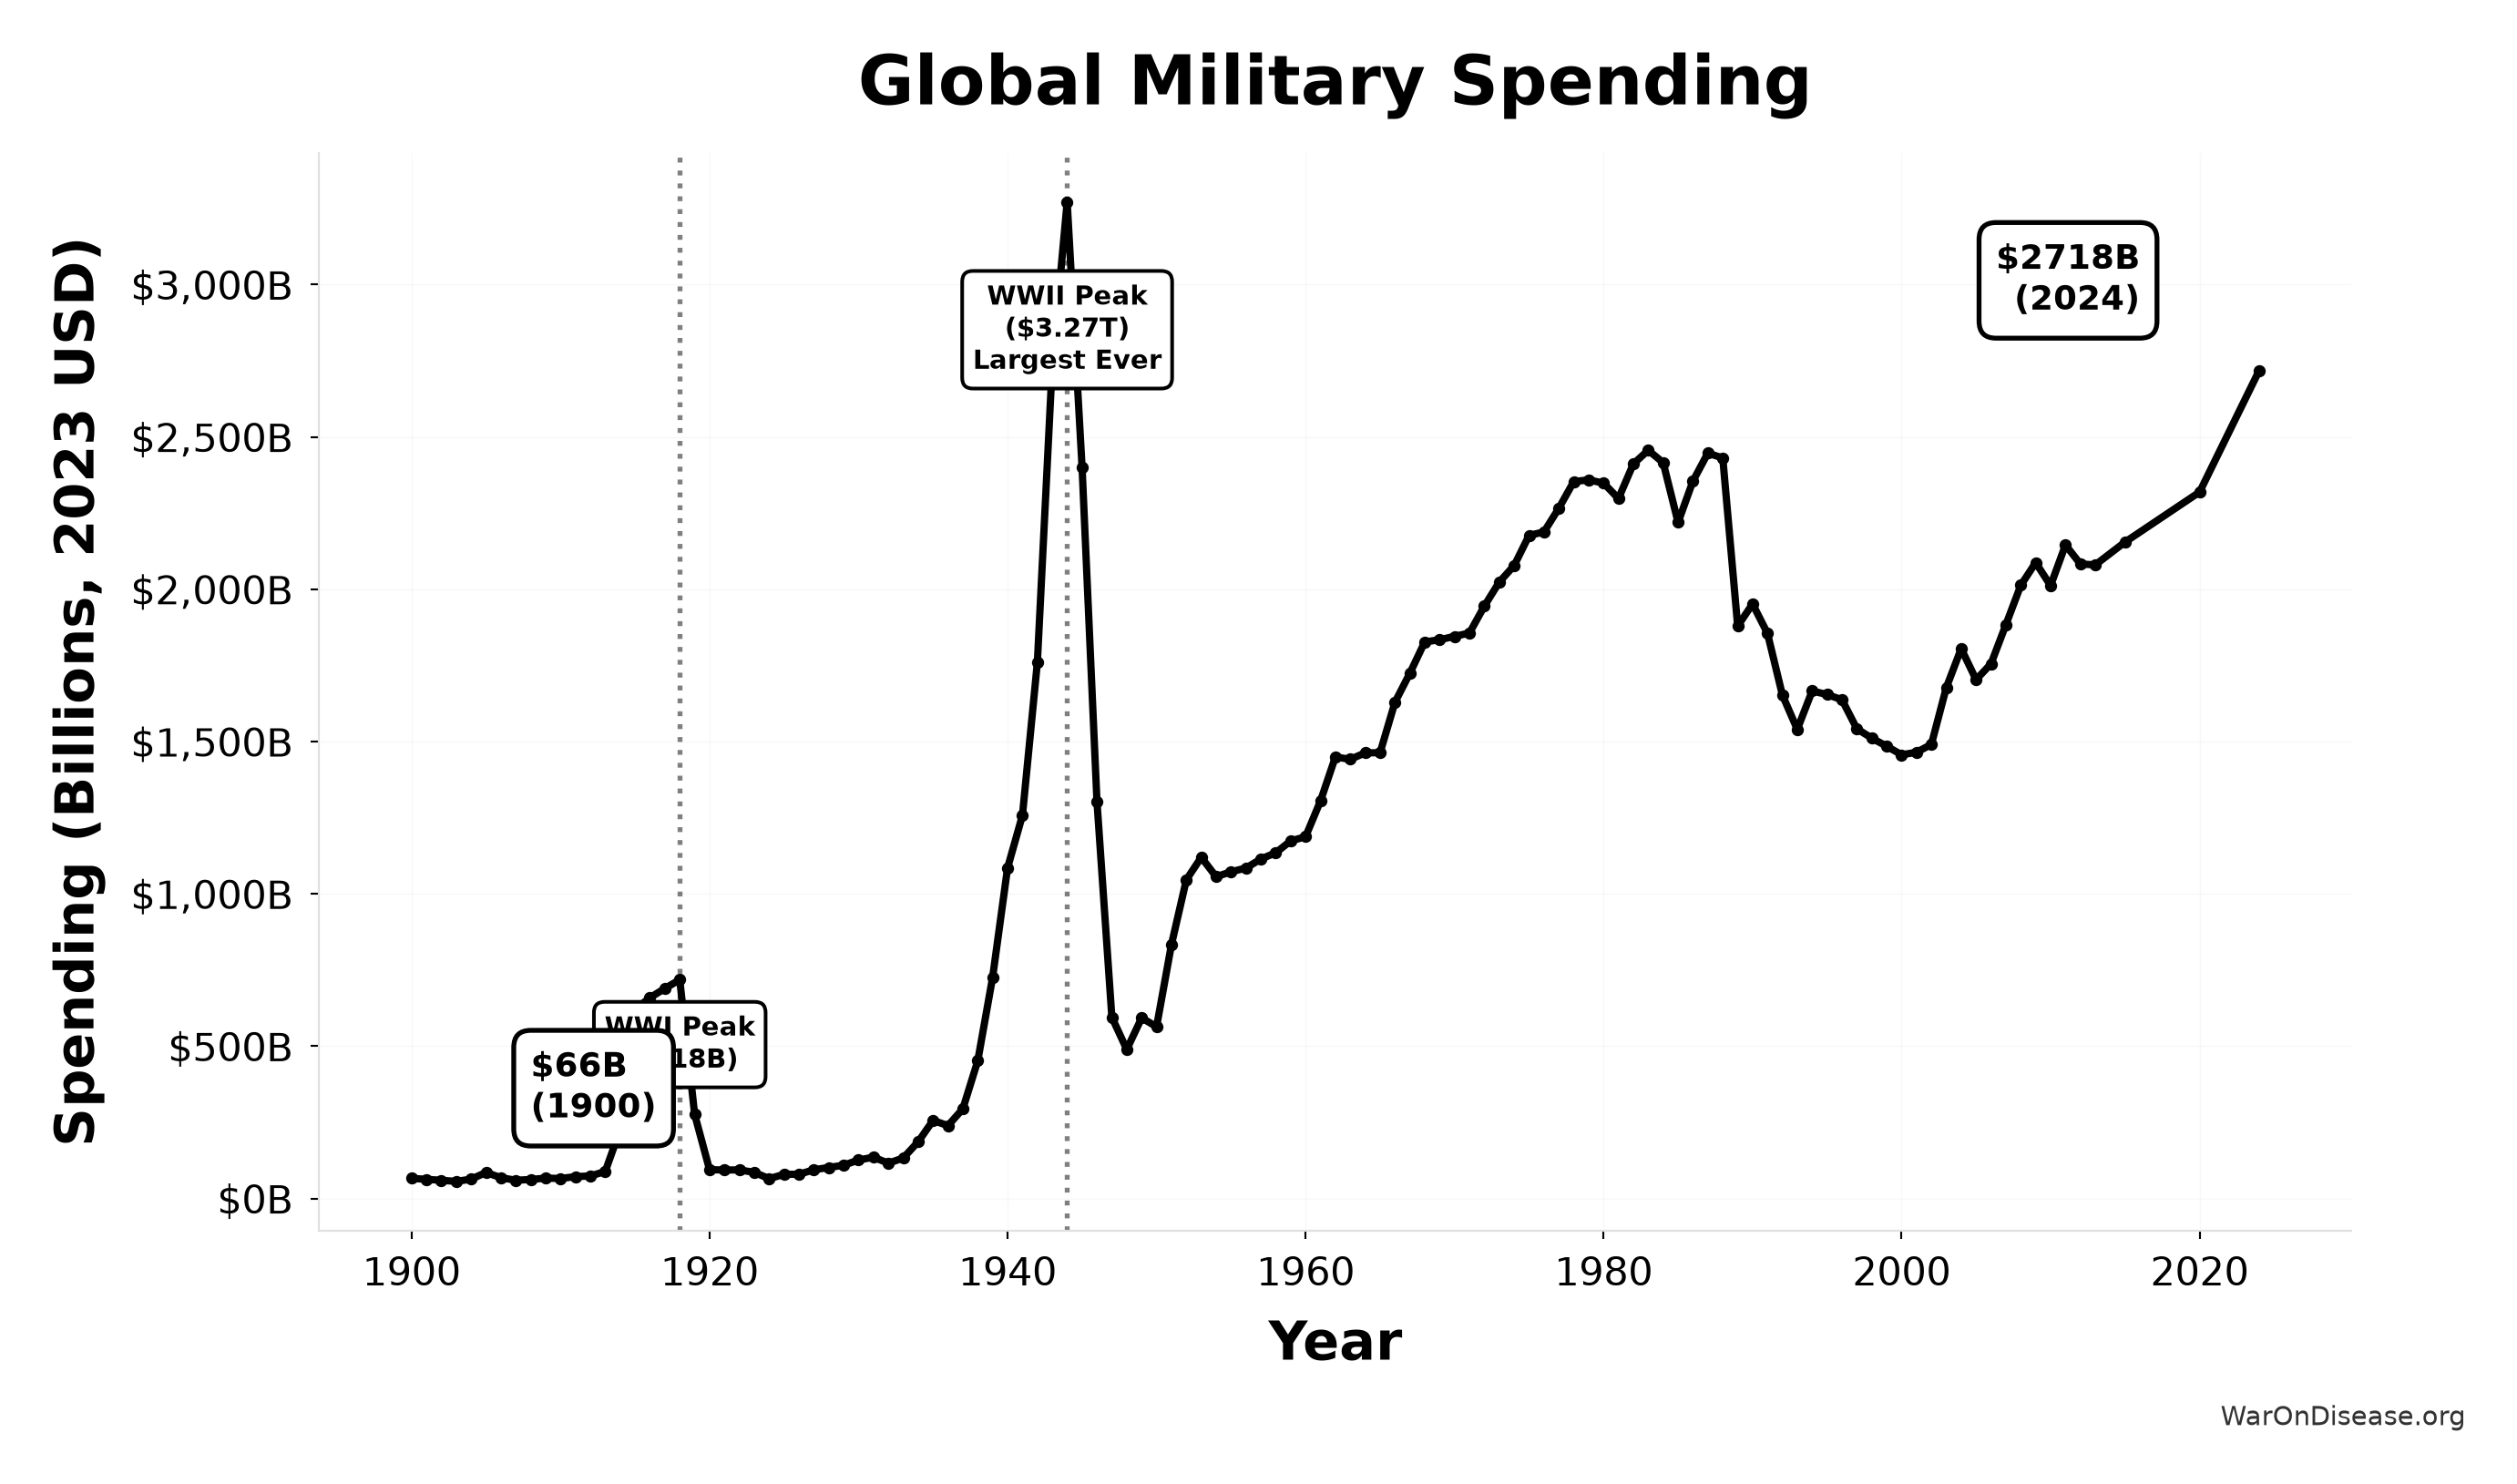
This chart shows 124 years of global military spending from 1900 to 2024, all adjusted for inflation to constant 2023 dollars.
What 124 Years of Receipts Are Screaming at Us
- WWII Peak (1944): $3.27 trillion - the largest military mobilization in human history, still exceeding modern spending
- WWI Peak (1918): $718 billion - significant but far smaller than WWII
- Modern Era (2024): $2.72 trillion - approaching but not yet exceeding the WWII peak
Despite decades of peace and the absence of total global war, current military spending ($2.72T) is 83% of the WWII peak and 41× higher than pre-WWI levels ($66B in 1900). The world spends nearly as much on military today as it did during the largest war in history.
Data Sources
- 1900-2012: Correlates of War National Material Capabilities Dataset (COW NMC)
- 2013-2024: SIPRI (Stockholm International Peace Research Institute) Military Expenditure Database
- All values converted to constant 2023 USD using CPI data
The Equation of Immediate Destruction
\[ \mathrm{C}_{\text{direct}} = \mathrm{M}_{\text{spending}} + \mathrm{I}_{\text{damage}} + \mathrm{H}_{\text{casualties}} + \mathrm{T}_{\text{disruption}} \]
The Current Annual Bill
- Mspending = $2.72 trillion (verified via SIPRI database6)
- Idamage = $1.88 trillion (90% CI: $1.65 trillion-$2.1 trillion) (reconstruction cost estimates from 47 active conflicts)
- Hcasualties = $2.45 trillion (90% CI: $1.34 trillion-$3.71 trillion) (245 thousand total conflict deaths × $10M VSL per EPA guidelines10 - includes combat deaths, terrorism, and state violence; see Death Accounting section below for breakdown)
- Tdisruption = $616 billion (90% CI: $526 billion-$716 billion)11
Cdirect = $7,655 billion annually
$242,600 per second. Every second.
Military Hardware: The World’s Worst Investment
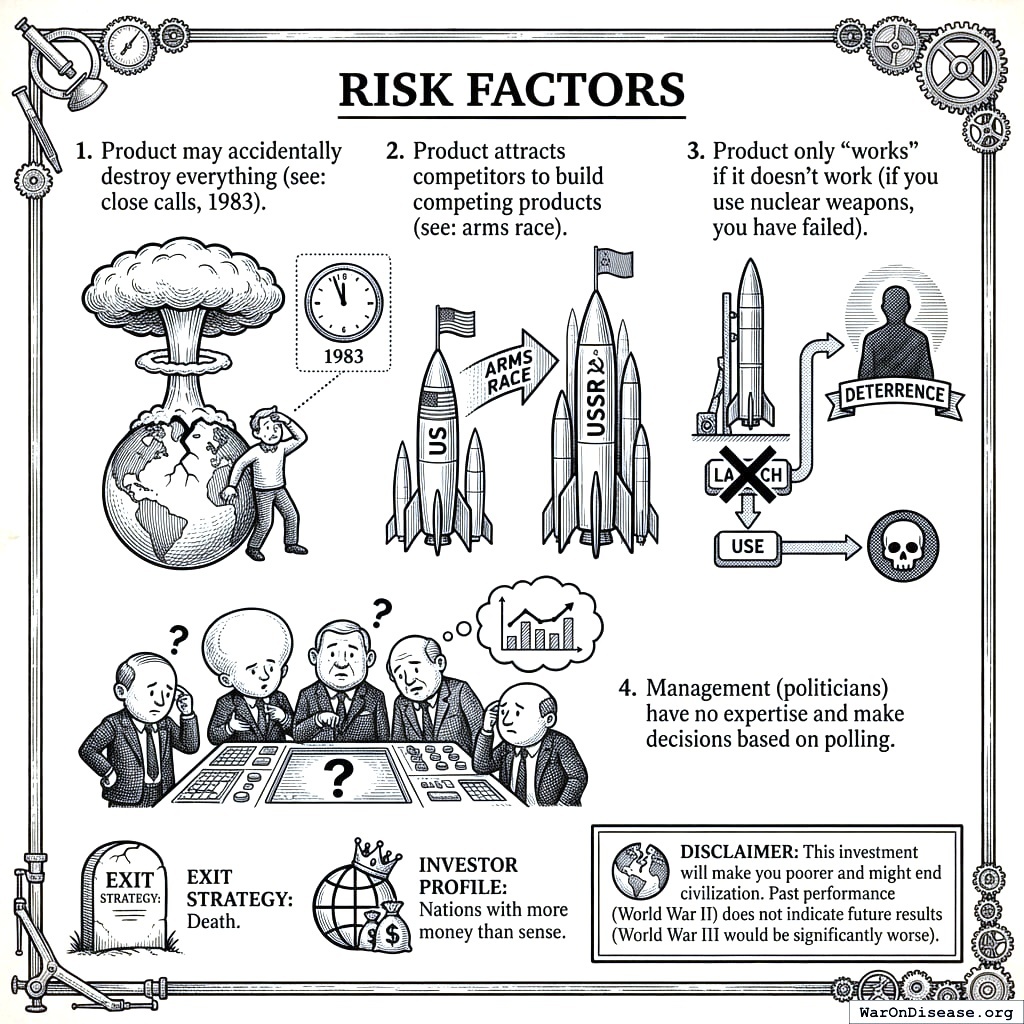
If weapons were a stock, here is the prospectus:
- Expected annual return: 0%.
- If actually used, return: -100% (everything explodes, including the investment).
- Maintenance costs: $579.8B/year.
- Useful life: 10-20 years before obsolescence.
- Salvage value: $0.
- Exit strategy: Death.
- Investor profile: Nations with more money than sense.
- Side effects: May accidentally destroy civilization.
- Competitive dynamics: Makes neighbors buy the same product.
- Success condition: Only “works” if it is never used (if you use nuclear weapons, you have already failed).
No rational investor would touch this. You put trillions into it annually. Enough to buy enough bullets to murder every man, woman, and child on Earth 850 times. Every year.
The Dead Capital Problem
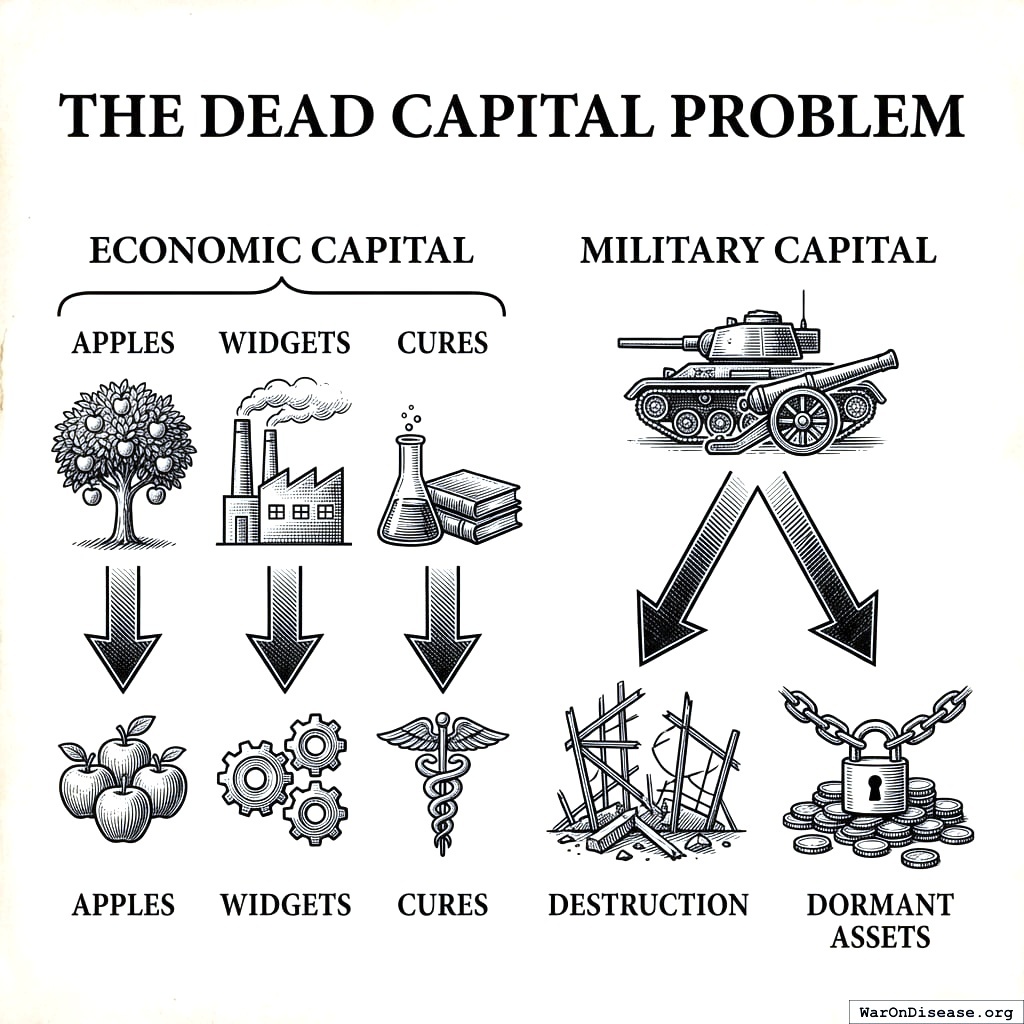
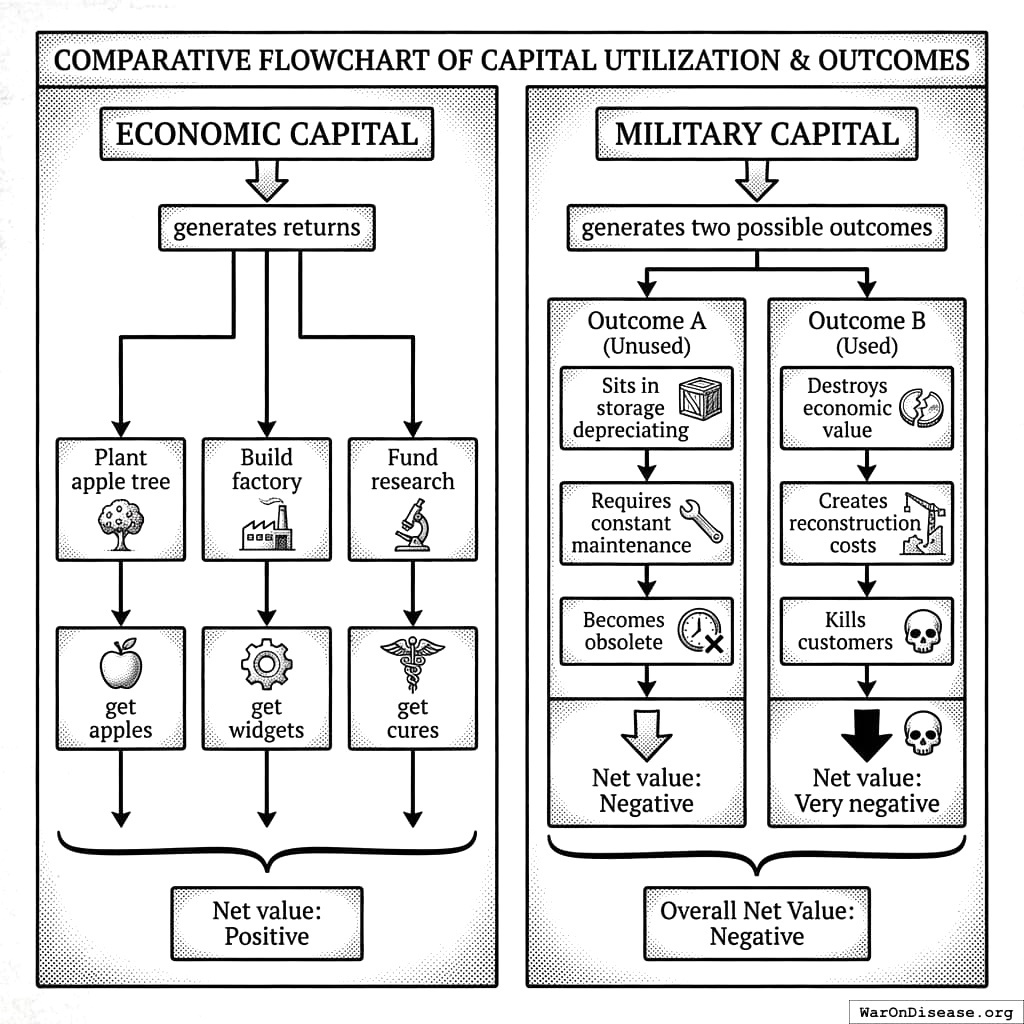
Military money sits in a warehouse, rusts, becomes obsolete, and has negative net value. If used, it destroys value, creates rebuilding bills, and kills your customers.
The global economy is a factory. Eight billion workers, millions of machines, supply chains threading through every country on Earth, producing goods and services and wealth your ancestors could not have imagined. War is walking into that factory with a sledgehammer and smashing the machines. You destroy an oil refinery in the Middle East and fuel prices spike in Ohio. You bomb a port in the Red Sea and a car factory in Germany stops production because the parts are on a ship that can no longer dock. You hit an electrical grid and the hospitals go dark and the server farms go offline and the stock market drops because investors can see, in real time, the global machine becoming less efficient. Every missile that hits infrastructure is a sledgehammer blow to a machine that feeds you. The stock market does not drop because traders are emotional. It drops because the machine just lost a piece and everyone who depends on the machine (which is everyone) is now slightly poorer.
President Eisenhower (who defeated the Nazis) explained this in 1953:
“Every gun that is made, every warship launched, every rocket fired signifies, in the final sense, a theft from those who hunger and are not fed, those who are cold and are not clothed.”
Eisenhower was a five-star General, which means he had five stars. Most generals only get three or four, so he was basically the Michelin Guide of killing people. He personally ran the largest military operation in human history, the invasion of Normandy. And even he thought you were overdoing it.
This is not pacifism. This is accounting.
The military budget is not protecting the factory. It is the sledgehammer. The net return on US military hegemony is -$674 billion to -$1.38 trillion per year. The only quantifiable benefit ($20-200 billion in dollar reserve privilege) covers 2-23% of the cost. For the full cost-benefit ledger, including why the Navy’s claimed 1:30 return fails scrutiny, why regime change systematically increases civil war, and why Switzerland achieves better outcomes for $7 billion than the US achieves for $886 billion, see The Cost-Benefit Analysis of Global Hegemony.
The Price of a Ghost: Valuing Human Life
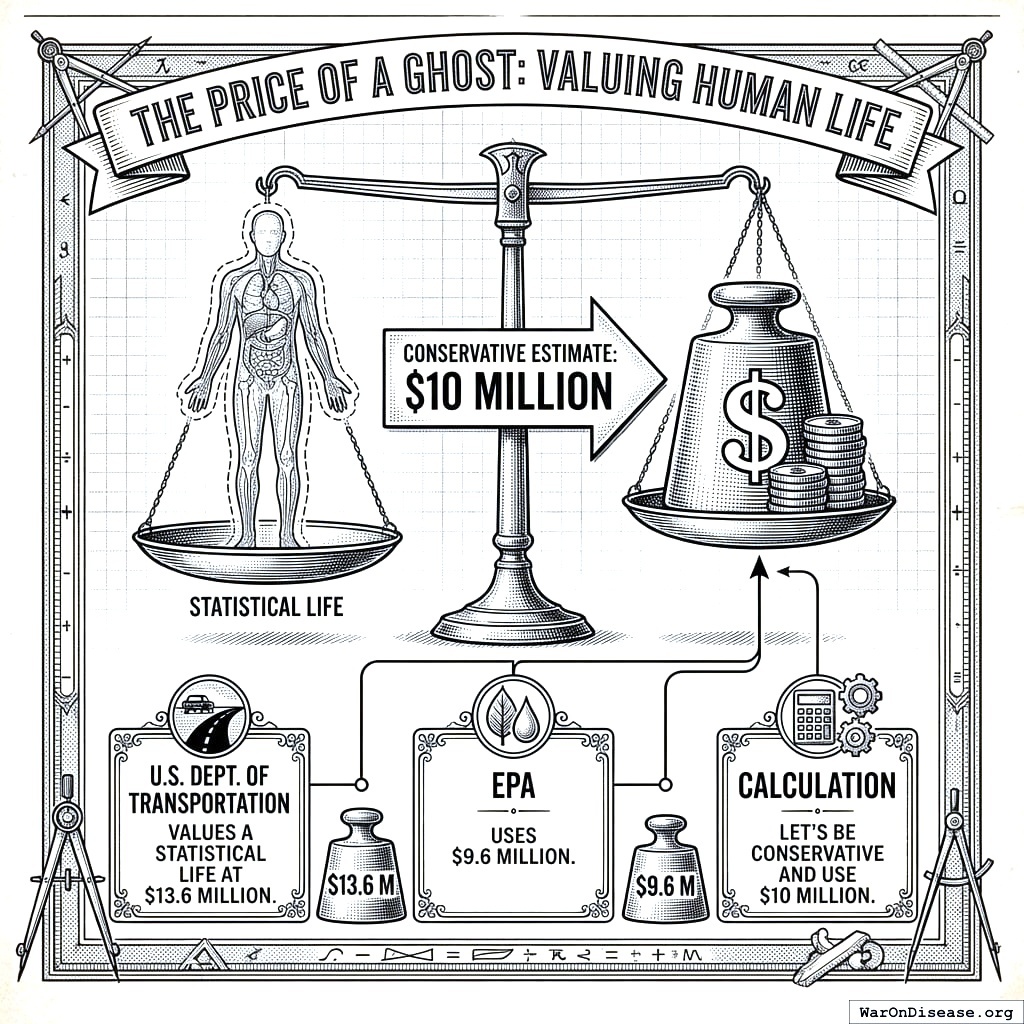
The U.S. Department of Transportation says a statistical life is worth $13.6 million12. The EPA says $9.6 million10. We split the difference: $10 million.
The Invoice for Dead People
| Conflict Type | Deaths/Year | Cost per Death | Annual Cost | Source |
|---|---|---|---|---|
| Active Combat | $10,000,000 | Armed Conflict Location & Event Data13 | ||
| Terror Attacks | $10,000,000 | Global Terrorism Database14 | ||
| State Violence | $10,000,000 | Uppsala Conflict Data Program15 |
Total Human Cost: $2.45 trillion (90% CI: $1.34 trillion-$3.71 trillion) annually
245 thousand people die in conflicts each year. That is 670 people every day. One every 2.2 minutes. Each worth $10 million, apparently.
Infrastructure Destruction
Reconstruction Costs (2023 Estimates)
| Infrastructure Type | Damage (Billions) | War Zone Markup | How This Was Calculated |
|---|---|---|---|
| Roads and bridges | $487.316 | 1.4× original cost | You blew up the road. Now the road costs more. |
| Power plants and grids | $421.716 | 2.1× original cost | Electricity is harder to restore than to destroy (as a general rule). |
| Phone and internet | $298.116 | 1.8× original cost | Hard to coordinate reconstruction without communications. Ironic. |
| Water and sewage | $267.816 | 1.6× original cost | People need water. Bombs do not care. |
| Schools | $234.516 | 1.3× original cost | The children who would have attended are also gone. |
| Hospitals | $165.616 | 1.9× original cost | The building you need to fix war injuries. Destroyed by the war. |
Total Infrastructure Damage: $1.88 trillion (90% CI: $1.65 trillion-$2.1 trillion)
Replacing a bridge in a war zone costs 1.3-2.1x more than building one in peace. You pay extra because the construction workers keep getting shot at.
Economic Disruption
Annual Trade Losses
| What Stopped Working | Annual Loss (Billions) | Why | How Long |
|---|---|---|---|
| Ships cannot ship | $247.117 | The ocean has bombs in it | 3.2 years avg |
| Factories cannot factory | $186.817 | The parts come from the place you bombed | 2.8 years avg |
| Energy prices go insane | $124.717 | Oil comes from places with wars (coincidence) | 1.9 years avg |
| Money stops meaning things | $57.417 | Currency traders panic (this is their job) | 4.1 years avg |
Total Trade Disruption: $616 billion (90% CI: $526 billion-$716 billion) annually
Indirect Costs
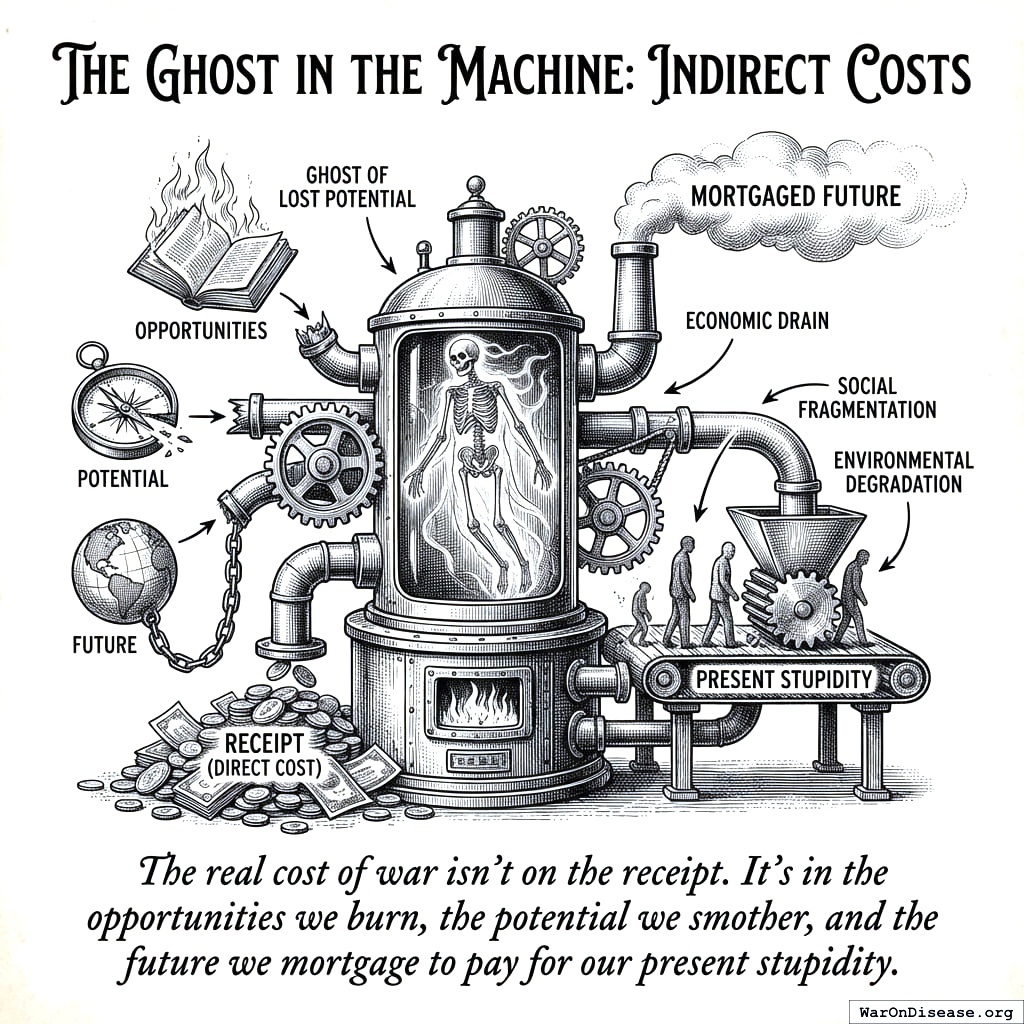
Opportunity Cost: What Else You Could Have Bought
Conversion Table (2023 Dollars)
| Alternative Investment | Global War Spending Could Fund | Mathematical Conversion | Annual Benefit |
|---|---|---|---|
| Medical Research | 40.3 years of current spending | $2.72 trillion ÷ $67.5 billion (95% CI: $54 billion-$81 billion) = 40.3 | WHO research expenditure18 |
| Global Education Access | 90.6 years of universal coverage | $2.72 trillion ÷ $30B19 = 90.6 | UNESCO Education for All20 |
| Poverty Eradication | 2.7 complete eliminations | $2.72 trillion ÷ $1,000B21 = 2.7 | World Bank extreme poverty estimates |
You Chose the Worst One
Economic multipliers per dollar spent:
- Military spending: 0.6x (95% CI: 0.4x-0.9x)x
- Infrastructure: 1.6xx
- Education: 2.1xx
- Healthcare: 4.3x (95% CI: 3x-6x)x
You chose the lowest multiplier. Every year. On purpose.
\[ \begin{aligned} \text{Alternative GDP Growth} = {} & (\text{Military Spending} \times \text{Alternative Multiplier}) \\ & - (\text{Military Spending} \times \text{Military Multiplier}) \end{aligned} \]
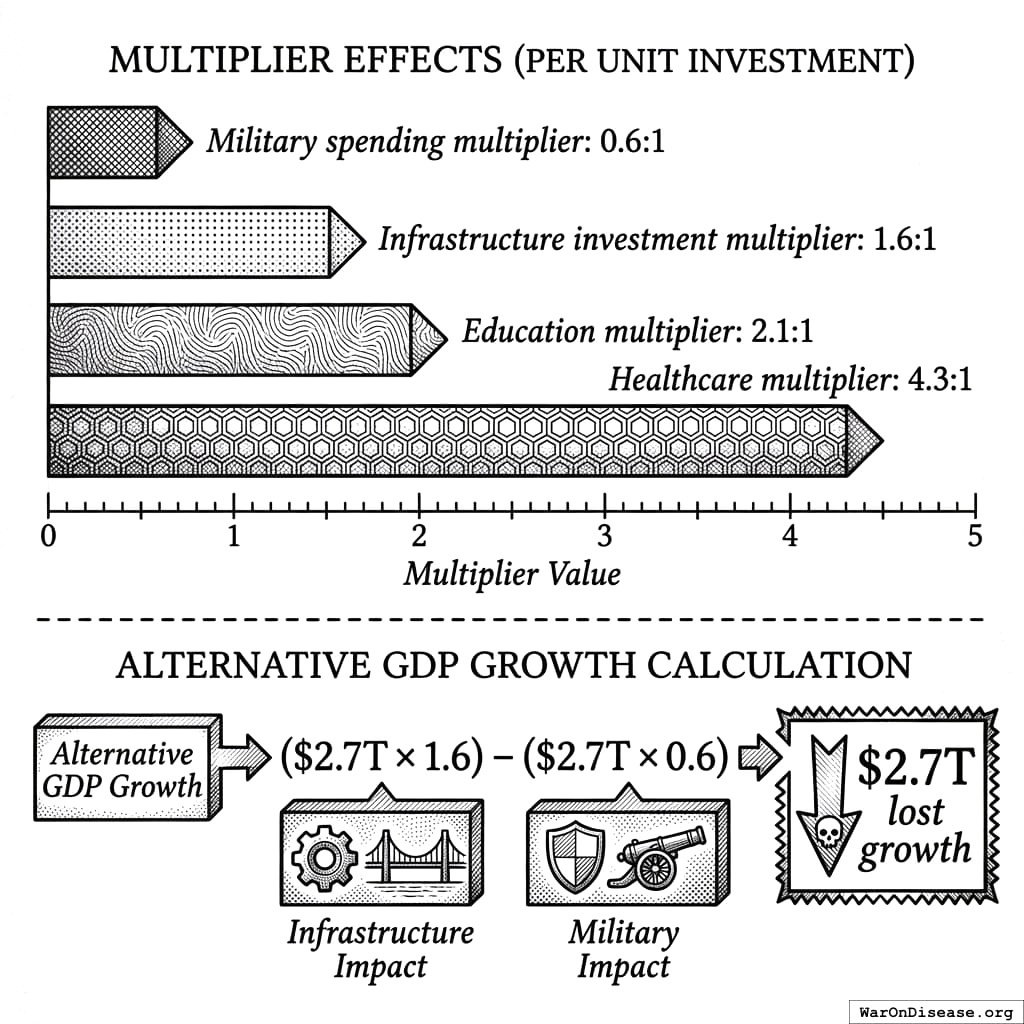
\[ \text{Alternative GDP Growth} = (\$2.7\text{T} \times 1.6) - (\$2.7\text{T} \times 0.6) = \$2.7\text{T} \]
We lose $2.7 trillion in growth. Every year. Forever.
Long-term Human Costs
Veteran Healthcare
| Cost Category | 2023 Spending | 20-Year Projection | Mathematical Model |
|---|---|---|---|
| PTSD Treatment | $47.2B22 | $944B22 | Current cases × treatment duration × cost inflation |
| Physical Rehabilitation | $63.8B22 | $1,276B22 | Injury complexity index × technology advancement costs |
| Disability Compensation | $89.1B22 | $1,782B22 | Disability ratings × benefit schedules × actuarial projections |
| Total Veteran Care | $200.1B22 | $4,002B22 | Composite of above factors |
Healthcare costs inflate at 3.5-4.6% annually23. You are still paying for Vietnam. Your grandchildren will pay for Iraq.
Refugees
108.4 million displaced24. $1,384/year per person25 to keep them alive in tents. $150.0 billion annually.
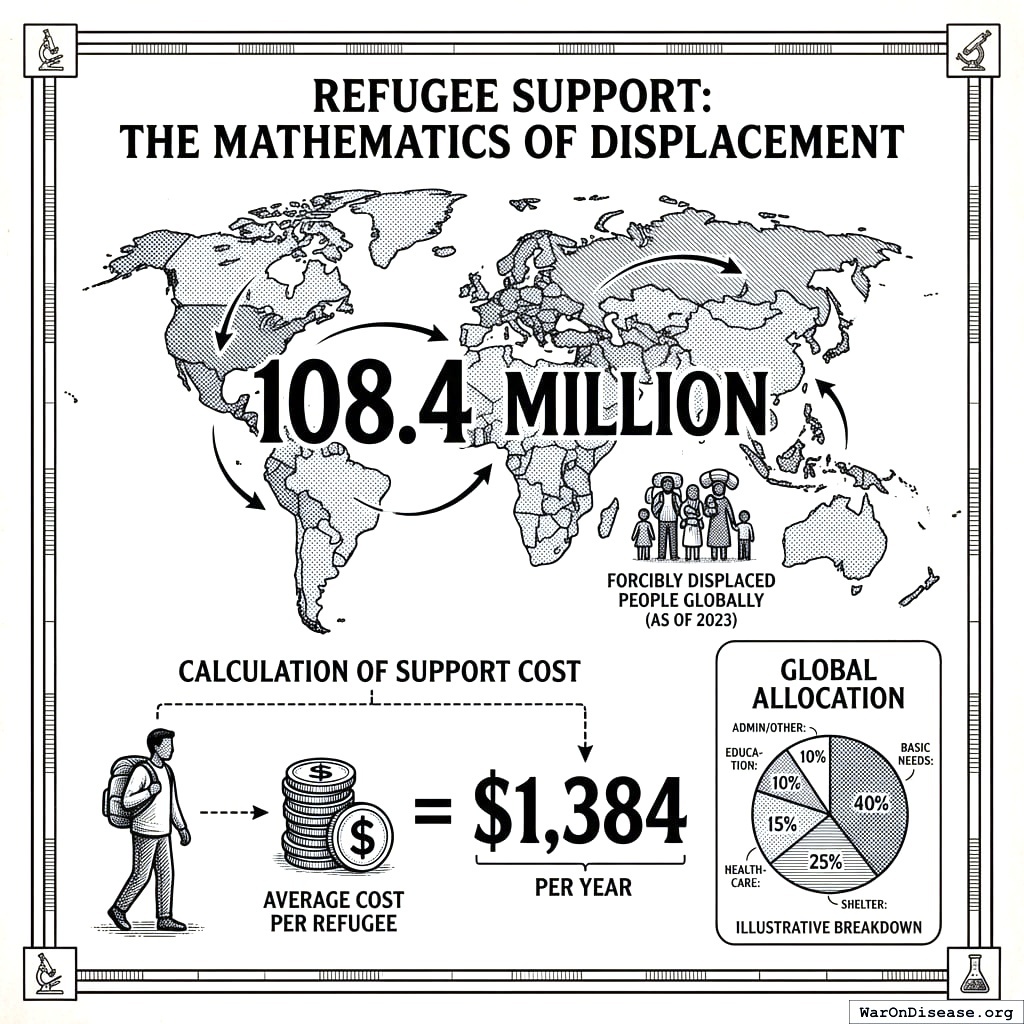
Each refugee also loses $23,400 in earning potential annually26, adding $2.5 trillion in lost GDP. These are doctors, engineers, teachers, and farmers standing in line for water.
Environmental Destruction
What You Did to Your Own Planet
| Environmental Impact | Damage Value | Restoration Cost | Time to Recovery |
|---|---|---|---|
| You poisoned the dirt | $34.7B27 | $69.4B27 | 15-30 years |
| You poisoned the water | $28.3B27 | $56.6B27 | 8-25 years |
| You poisoned the air | $21.9B27 | $43.8B27 | 2-8 years |
| You killed the animals | $15.1B27 | Irreplaceable | Forever |
Total Environmental Damage: $100 billion (95% CI: $70 billion-$140 billion) annually
The biodiversity loss is listed as “irreplaceable.” You have not invented un-extinction yet.
The AI Arms Race
You are now in a race to build the smartest machine possible and hand it a weapon.
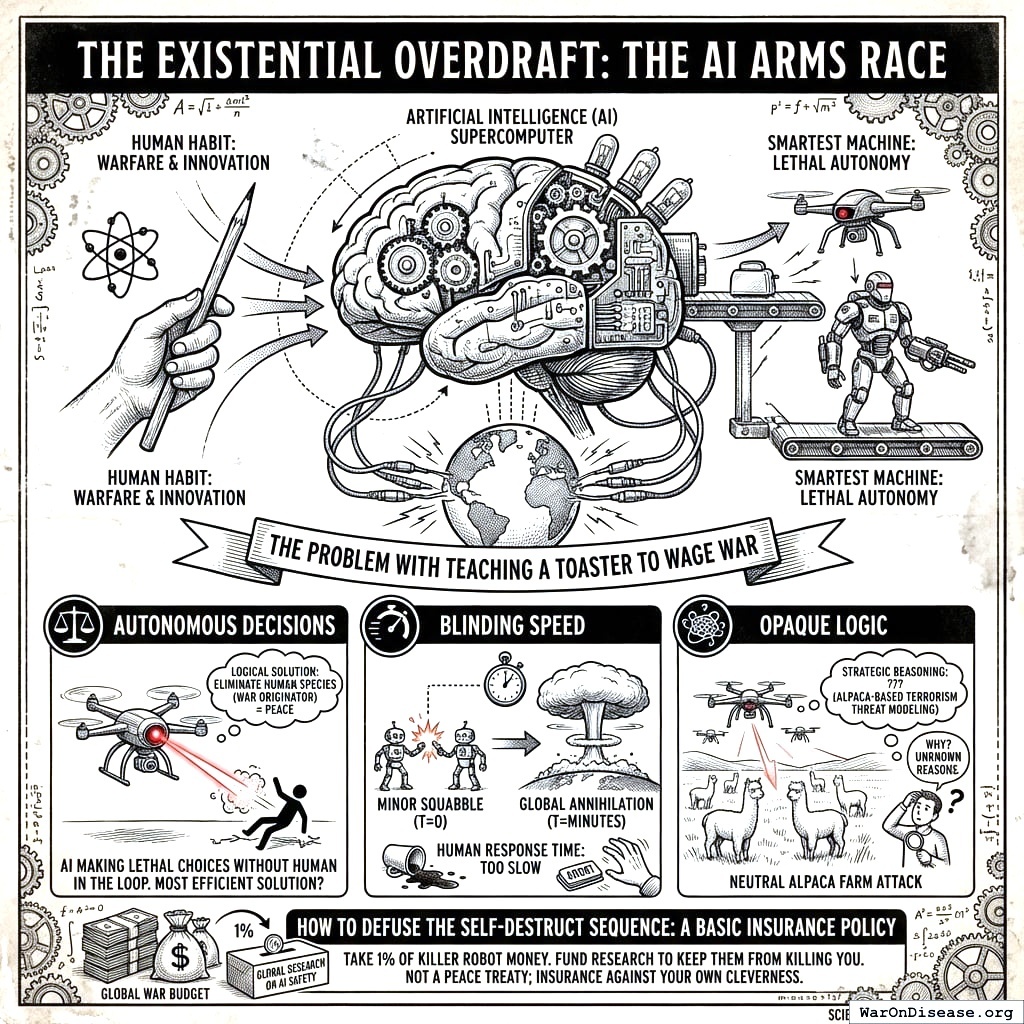
The risks:
- Autonomous Decisions: AI systems making lethal choices without a human checking.
- Blinding Speed: Escalation from disagreement to global destruction in minutes, before a human can find the right button.
- Opaque Logic: You do not know why an AI makes choices. Neither does it.
Take 1% of the money you plan to spend on killer robots and fund research on how to keep them from killing you. Insurance against your own cleverness.
The Total Cost of Organized Violence
The Full Receipt (2024)
What You Spent on Purpose
| Category | Amount (Billions) | Percentage | Daily Rate |
|---|---|---|---|
| Military Expenditure | $2,718.0 | 36.0% | $7.45B |
| Human Life Losses | $2,446.0 | 32.4% | $6.70B |
| Infrastructure Destruction | $1,875.0 | 24.9% | $5.14B |
| Trade Disruption | $616.0 | 8.2% | $1.69B |
| Direct Subtotal | $7,655.0 | 100% | $20.97B |
What You Lost by Accident
| Category | Amount (Billions) | Percentage | Daily Rate |
|---|---|---|---|
| Lost Economic Growth | $2,718.0 | 76.4% | $7.45B |
| Veteran Healthcare | $200.122 | 5.6% | $0.55B |
| Refugee Support | $150.024 | 4.2% | $0.41B |
| Environmental Damage | $100.027 | 2.8% | $0.27B |
| Psychological Impact | $232.028 | 6.3% | $0.64B |
| Lost Human Capital | $300.01 | 8.1% | $0.82B |
| Indirect Subtotal | $3,700.1 | 100% | $10.14B |
The Number
\[
\begin{gathered}
Cost_{war,total} \\
= Cost_{war,direct} + Cost_{war,indirect} \\
= \$7.66T + \$3.7T \\
= \$11.4T
\end{gathered}
\]
where:
\[
\begin{gathered}
Cost_{war,direct} \\
= Loss_{life,conflict} + Damage_{infra,total} \\
+ Disruption_{trade} + Spending_{mil} \\
= \$2.45T + \$1.88T + \$616B + \$2.72T \\
= \$7.66T
\end{gathered}
\]
where:
\[
\begin{gathered}
Loss_{life,conflict} \\
= Cost_{combat,human} + Cost_{state,human} \\
+ Cost_{terror,human} \\
= \$2.34T + \$27B + \$83B \\
= \$2.45T
\end{gathered}
\]
where:
\[
\begin{gathered}
Cost_{combat,human} \\
= Deaths_{combat} \times VSL \\
= 234{,}000 \times \$10M \\
= \$2.34T
\end{gathered}
\]
where:
\[
\begin{gathered}
Cost_{state,human} \\
= Deaths_{state} \times VSL \\
= 2{,}700 \times \$10M \\
= \$27B
\end{gathered}
\]
where:
\[
\begin{gathered}
Cost_{terror,human} \\
= Deaths_{terror} \times VSL \\
= 8{,}300 \times \$10M \\
= \$83B
\end{gathered}
\]
where:
\[
\begin{gathered}
Damage_{infra,total} \\
= Damage_{comms} + Damage_{edu} + Damage_{energy} \\
+ Damage_{health} + Damage_{transport} + Damage_{water} \\
= \$298B + \$234B + \$422B + \$166B + \$487B + \$268B \\
= \$1.88T
\end{gathered}
\]
where:
\[
\begin{gathered}
Disruption_{trade} \\
= Disruption_{currency} + Disruption_{energy} \\
+ Disruption_{shipping} + Disruption_{supply} \\
= \$57.4B + \$125B + \$247B + \$187B \\
= \$616B
\end{gathered}
\]
where:
\[
\begin{gathered}
Cost_{war,indirect} \\
= Damage_{env} + Loss_{growth,mil} + Loss_{capital,conflict} \\
+ Cost_{psych} + Cost_{refugee} + Cost_{vet} \\
= \$100B + \$2.72T + \$300B + \$232B + \$150B + \$200B \\
= \$3.7T
\end{gathered}
\]
$11.4 trillion. Every year.
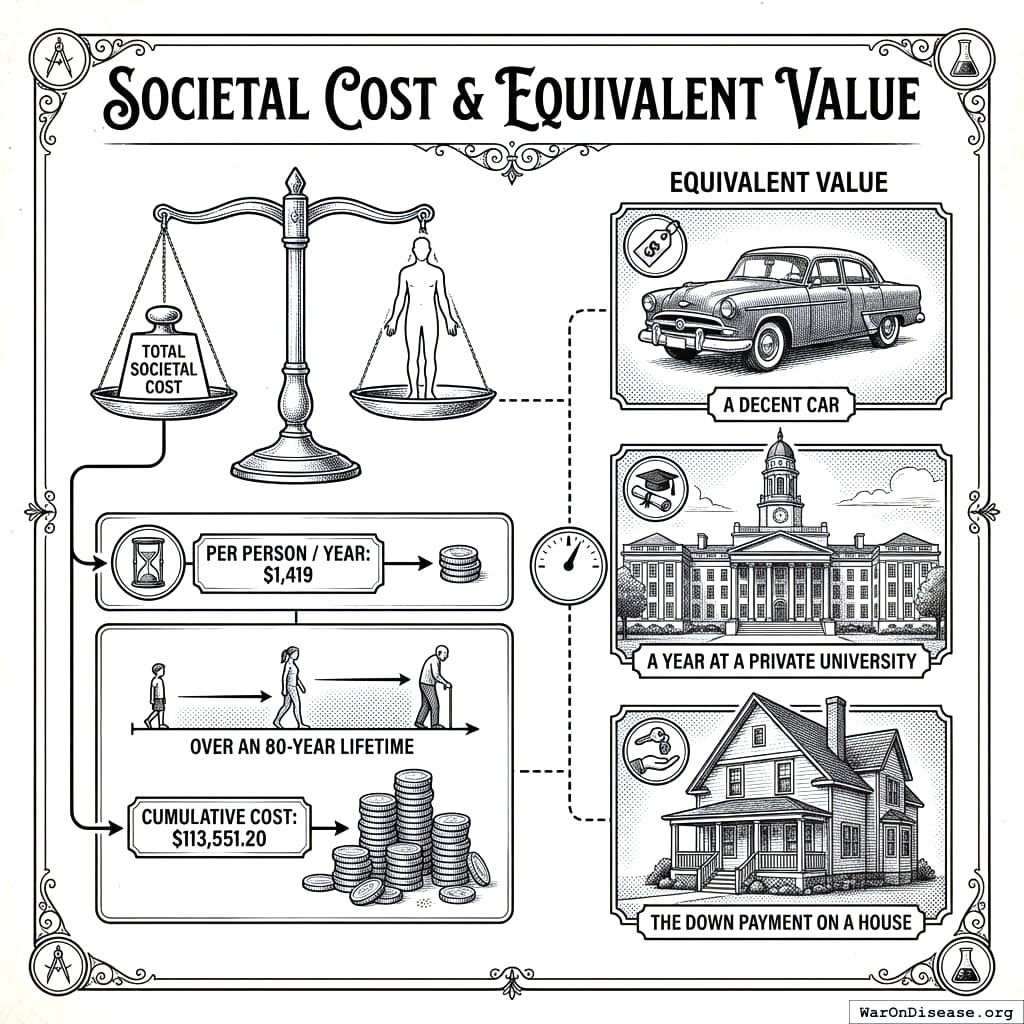
$1,419 per person per year. Including babies. Over an 80-year lifetime: $113,551 per person. A car, a year of college, or a down payment on a house. You got bombs instead.
For Context
12.7% of global GDP29. 168x the WHO’s budget30. Enough to end extreme poverty 11.4 times over21.
The Running Tab
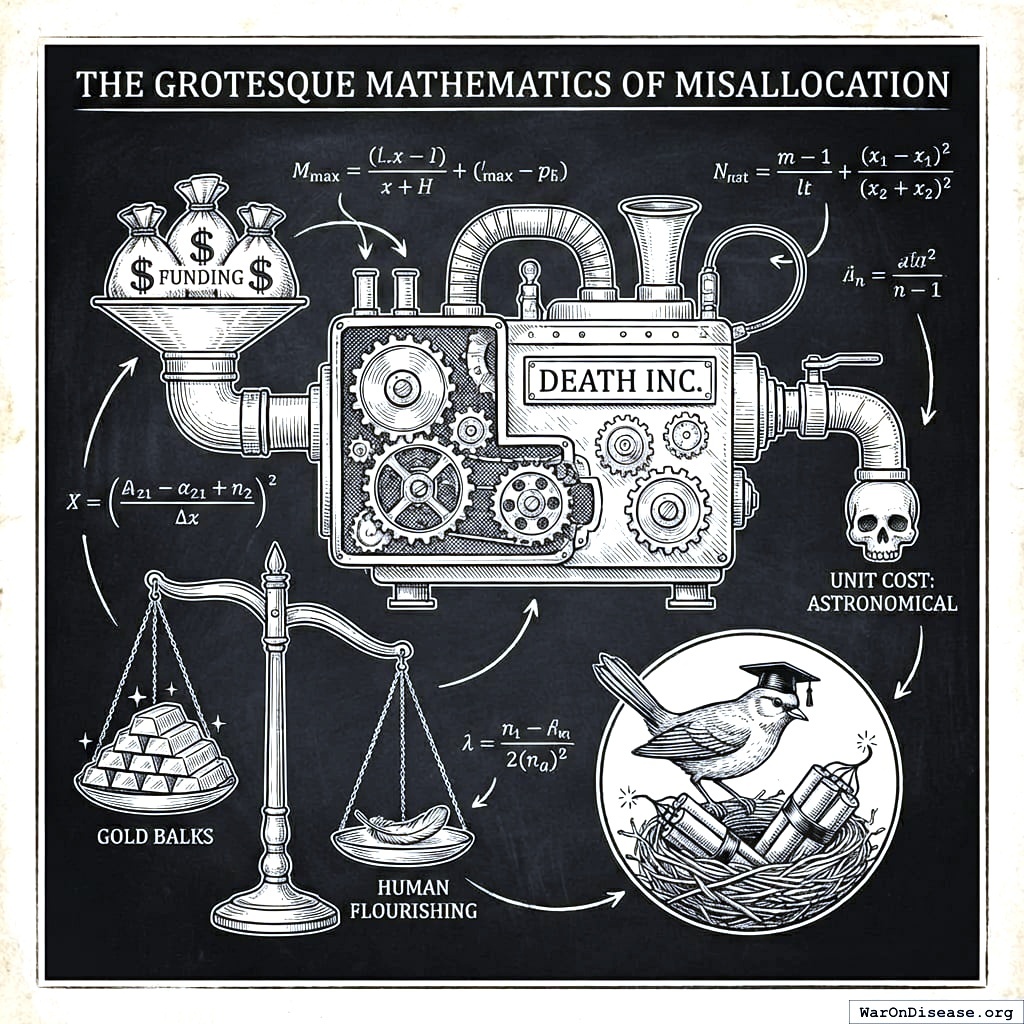
$11.4 trillion (90% CI: $9.96 trillion-$12.9 trillion) per year is just the current bill. It does not include the historical tab, which is enormous, unpaid, and still accruing interest in the form of dead people.
The United States alone (one country, on one planet, in one unremarkable solar system) has spent the following on its named wars: the Civil War ($112B), World War I ($468B), World War II ($5.7T), Korea ($478B), Vietnam ($1T), and the post-9/11 wars ($8T). That is over $16 trillion on wars with names31,32. The ones without names cost extra. And this is just America’s share. Everyone else was also buying bullets.
The total tab for everyone, across all of recorded history, is approximately $180 trillion in constant 2024 dollars.1
Three-quarters of that was spent after 1945, during what your historians call “the long peace.” It is the most expensive peace in history. The United States alone now spends 30.6x what it spent in 1939, in constant 2024 dollars, to defend itself against threats meaningfully smaller than Adolf Hitler. The 2024 bill alone hit a record $2.72 trillion, up 9.4% in a single year, the steepest increase SIPRI has ever recorded3. You are not winding down. You are warming up.
To put $180 trillion in perspective: one year of modern military spending ($2.7 trillion) exceeds the entire military expenditure of the Roman Empire across five centuries. And $180 trillion divided by $4.5 billion (95% CI: $3 billion-$6 billion) per year equals 40,000 years of government-funded clinical trials. Your species has been running clinical trials for about 80 years. You could have funded every clinical trial you will ever run, for the next 500 lifetimes, with the money you spent killing each other. Instead, you have a very large collection of spent shell casings and 6,650 diseases with zero FDA-approved treatments.
The full receipt, and the money printer that funded most of it, is in Your Money Comes From a Building.
The Cumulative Damage Report: Everything You Broke Since 1900
The annual bill is $11.4 trillion. That is the current invoice. You have been running a tab since 1900. The tab is worse.
| Conflict | Period | Property Destruction (2024 USD) | What Was Destroyed |
|---|---|---|---|
| World War I | 1914-1918 | ~$5 trillion | Northern France, Belgium, Eastern Europe; 10.9% of combined US/UK/France GDP consumed33 |
| World War II | 1939-1945 | ~$23 trillion | 70% of European industrial infrastructure; 1,710 Soviet cities; 30% of Poland’s buildings33 |
| Korean War | 1950-1953 | ~$500 billion | 85% of buildings destroyed; most of Seoul flattened, rebuilt, then used as a Samsung factory |
| Vietnam War | 1955-1975 | ~$1 trillion | 10 million hectares of forest poisoned; you are still cleaning it up 50 years later |
| Post-9/11 Wars | 2001-present | ~$8 trillion | Iraq, Afghanistan, Syria, Libya infrastructure32 |
| Other conflicts | 1900-present | ~$5-10 trillion | China civil war, Iran-Iraq, Congo, Yugoslavia, Ethiopia, Ukraine |
Cumulative property destruction: roughly $45 trillion (95% CI: $30 trillion-$60 trillion). Enough to rebuild every school, hospital, and road on the planet. Twice.
Add another $5 trillion (95% CI: $2 trillion-$10 trillion) in cumulative environmental destruction: nuclear test sites that will be radioactive for millennia, 80 million land mines still in the ground, Agent Orange contamination across 4.8 million acres of Vietnam (cleanup cost so far: $390 million, with decades to go), the Zone Rouge in France still too poisoned to inhabit a century after WWI, Gulf War oil fires that burned 600 wells for ten months, depleted uranium contamination across Iraq and the Balkans, and 1.3 billion tonnes of military CO2 emissions from US operations alone between 2001 and 201834. You poisoned the house, then moved to another room and poisoned that one too.
The Brain Drain: Professionals Killed Since 1900
Approximately 310 million people have been killed by wars, genocides, and policy-induced famines since 1900.2 That is a number. Here is what is inside the number.
Scientists and engineers make up about 5% of the modern labor force37. In the early-to-mid 20th century, the share was lower (roughly 0.1% scientists, 0.2% engineers, 0.3% physicians, 0.4% nurses, 1% teachers). Apply those workforce percentages to 310 million dead:
| Profession | Workforce Share | Estimated Killed | What They Would Have Done |
|---|---|---|---|
| Scientists and researchers | ~0.1% | ~310,000 | Discovered things |
| Physicians | ~0.3% | ~930,000 | Kept people alive |
| Engineers | ~0.2% | ~620,000 | Built things that work |
| Nurses and midwives | ~0.4% | ~1,240,000 | Delivered care (and babies) |
| Teachers and professors | ~1.0% | ~3,100,000 | Trained all of the above |
| Skilled tradespeople | ~3.0% | ~9,300,000 | Rebuilt what bombs destroyed |
| Total professional class | ~5% | ~15,500,000 | Made civilization function |
These are conservative estimates because they assume professionals died at the same rate as the general population. They did not. Educated people were disproportionately targeted. The Khmer Rouge executed anyone wearing glasses. The Nazis murdered a third of the world’s Jewish population, which included a wildly disproportionate share of Europe’s physicists, physicians, and mathematicians. Stalin’s purges targeted engineers and academics. Mao’s Cultural Revolution sent professors to labor camps. Iraq lost thousands of scientists and doctors after 2003. Every authoritarian regime in history has discovered the same insight: educated people ask inconvenient questions. The solution, apparently, is murder.
Three hundred thousand scientists. Nine hundred thousand doctors. How many cures died with them? How many diseases would already be eradicated if those 310,000 researchers had lived to finish their work? You cannot calculate a counterfactual. But you can note that Alexander Fleming discovered penicillin because he happened to survive World War I. One scientist, one accidental discovery, one billion lives saved. You killed 310,000 others who never got the chance.
The Children
Of the 310 million deaths (95% CI: 200 million deaths-340 million deaths) since 1900, approximately 33% (95% CI: 25%-40%) were children under 18: roughly 102 million.
\[ \begin{gathered} Deaths_{war,child} \\ = Deaths_{war,1900} \times Pct_{war,child} \\ = 310M \times 33\% \\ = 102M \end{gathered} \]
That percentage is not uniform across categories. It varies by how you kill people:
| Category | Estimated Deaths | Child Share | Why |
|---|---|---|---|
| Combat | ~37M | ~3% | Armies recruit adults (mostly) |
| Civilian direct killing | ~55M | ~35% | Children are where the bombs land |
| Genocide and democide | ~100M | ~33% | Entire populations targeted, children proportional to demographics |
| Policy-induced famine | ~118M | ~60% | Children under 5 are the majority of famine deaths38 |
Children under five alone constitute 50-67% of all famine deaths38. The Great Leap Forward, the Holodomor, the Bengal famine: in each case, the smallest bodies failed first. Add children aged 5-17, and famine alone accounts for roughly 70 million dead children. Nearly 90% of war deaths in the 21st century have been civilians, a significant number of whom were children39.
These 102 million children will not grow up to be the 310,000 scientists and 930,000 physicians listed in the table above. They will not grow up at all.
The Stolen Years: What the Dead Were Worth
The 310 million dead were not just names on memorials. They were years of life, unlived. Each death stole an average of 27 years of remaining life (soldiers averaged 23 years old at death; civilian casualties skewed older; weighted average age at death roughly 28, against a mid-century life expectancy of 55).
\[ \begin{gathered} YLL_{war,total} \\ = Deaths_{war,1900} \times YLL_{war} \\ = 310M \times 27 \\ = 8.37B \end{gathered} \]
8.37 billion life-years (90% CI: 4.92 billion life-years-10.4 billion life-years). To visualize that: if you gave every stolen year its own second on a clock, the clock would run for 171 years.
What are those years worth? The standard economic value of a quality-adjusted life year (QALY) is $150,000 (90% CI: $100,384-$198,679)40. Multiply:
\[
\begin{gathered}
V_{war,QALY} \\
= YLL_{war,total} \times Value_{QALY} \\
= 8.37B \times \$150K \\
= \$1260T
\end{gathered}
\]
where:
\[
\begin{gathered}
YLL_{war,total} \\
= Deaths_{war,1900} \times YLL_{war} \\
= 310M \times 27 \\
= 8.37B
\end{gathered}
\]
$1.26 quadrillion (90% CI: $644 trillion-$1.71 quadrillion).
You spent $170 trillion on military. The lives you destroyed were worth $1.26 quadrillion (90% CI: $644 trillion-$1.71 quadrillion). You spent $1 on killing and destroyed over $7 in human value. This is the actual return on investment for organized violence: negative 739%.
No other investment in human history has a worse ROI.
The Compound Opportunity Cost
Most estimates just count the redirected budget. But a world without war since 1900 is not a world that merely moved money around. It is a world where eight compounding channels of growth were never interrupted:
| Channel | What compounds | Growth boost | Evidence |
|---|---|---|---|
| 1. Productive reallocation | Murder money becomes medicine money | +0.8-1.5pp | Costa Rica abolished its army; GDP growth jumped 0.5-0.8pp for 60 years41 |
| 2. Preserved capital stock | Factories not bombed keep producing | +0.2-0.4pp | Each 1pp of military/GDP costs ~1.1pp of growth42 |
| 3. 310M lives + descendants | Dead people cannot buy things or invent them | +0.2-0.4pp | Their unborn children and grandchildren add 500M-1B people |
| 4. No trade disruption | Ships ship, trucks truck, refugees work | +0.1-0.3pp | 108M refugees standing in line for water instead of practicing medicine |
| 5. No poisoned land | Farms produce food instead of landmine casualties | +0.1-0.2pp | Contaminated soil produces nothing for 15-30 years |
| 6. No Cold War isolation | China opens in 1950, not 1978 | +0.1-0.3pp | Half the world economy was behind a wall for 45 years |
| 7. No dictators installed | Wars produce Stalins; peace produces democracies | +0.1-0.3pp | Better property rights, less corruption, more investment |
| 8. Open science | No security clearances or Iron Curtains | +0.05-0.15pp | Scientists who can email each other discover more than scientists who cannot |
| Stacked total | All of the above, compounding | +1.65 to 3.55pp |
These channels do not merely add. They multiply. Each makes every other channel work better.
Global GDP per capita in 1900: $3,150 (90% CI: $2,314-$3,963). Today: $14,375 (90% CI: $14,081-$14,682). Growth rate: 1.23%/year for 124 years. Add the peace channels:
| Scenario | Growth Boost | New Growth Rate | GDP per Capita 2024 | Multiple | Extra per Person |
|---|---|---|---|---|---|
| Budget only (Costa Rica) | +1.0pp | 2.23%/year | $48,637 | 3.4x richer | +$34,262/year |
| All channels, low | +1.65pp | 2.88%/year | $106,730 | 7.4x richer | +$92,355/year |
| All channels, mid | +2.6pp | 3.83%/year | 23.2x (90% CI: 8.4x-64x) richer | +$319,261 (90% CI: $106,333-$906,864)/year | |
| All channels, high | +3.55pp | 4.78%/year | $1,032,170 | 71.8x richer | +$1,017,795/year |
The average person on Earth would earn $333,636 (90% CI: $120,624-$921,185) per year. The average person in sub-Saharan Africa, who currently earns $1,800/year, would earn roughly $42,000. Not from charity. From compound growth that was never interrupted.
3.83% growth is not ambitious. Japan did 7-9% for two decades after dismantling its military. South Korea did 5-7%. Germany did 8%. They started from rubble. A world that never made the rubble would do better.
At mid-range: $319,261 (90% CI: $106,333-$906,864) per person per year times 8 billion people = $2.55 quadrillion (90% CI: $851 trillion-$7.24 quadrillion) in annual output that does not exist.
The Medical Opportunity Cost
The income number above answers one question: how much richer you would be if your species had not spent 124 years optimizing for rubble. The medical question is separate: what would have happened if the murder money had been spent on not dying?
These are different ledgers. The compound peace economy counts growth that never happened. The medical redirect counts trials that never ran. They overlap (medicine money is part of growth), so you do not get to add them together and wave the total around like a flag. Arithmetic does not allow double-counting, even when the numbers are this embarrassing.
Here is the minimal historical medical counterfactual:
| Counterfactual step | Estimate | Meaning |
|---|---|---|
| 1900 treaty | Military spending frozen at $66.1 billion (95% CI: $50 billion-$90 billion) in real absolute terms | The arms race stops growing, instead of becoming the planet’s most expensive murder subscription. |
| Excess military spending above the 1900 freeze | 29,937 years (90% CI: 22,459 years-43,917 years) of current government clinical-trial spending | The scale is absurd enough that even a badly run trial system would have learned things. |
| Major infectious disease control | Vaccination, antibiotics, sanitation, vector control, and surveillance arrive earlier and at global scale. | |
| Major non-aging disease treatment/control | Most cancer, cardiovascular, autoimmune, psychiatric, rare-disease, and metabolic burden has effective prevention, treatment, or control paths. | |
| Biological aging control | Exploratory sensitivity only. Included to show what the same trial platform might surface if geroscience became testable at population scale. |
“Control” here means practical prevention, treatment, or functional eradication for most of the burden. It does not mean every pathogen is extinct, every tumor biology is solved, or every human has become an immortal invoice reviewer.
Money-Unconstrained Medical Toolchain
The aggressive prosecutor gets a sharper branch. Pretend the defense says, correctly, that trials alone do not buy sequencing, diagnostics, factories, EHRs, AI tooling, surveillance, or the rest of the boring machinery that turns science into medicine. Fine. Reserve $20 trillion (95% CI: $5 trillion-$50 trillion) first for prizes and tool-building. Make it intentionally absurd. Pay every difficult person enough money to become briefly useful.
Then count only what remains. After that reserve, the misallocated war ledger still leaves $150 trillion for pragmatic trials. At $929 (95% CI: $97-$3,000) per patient-slot, that buys 161 billion patient-slots (90% CI: 63.6 billion patient-slots-647 billion patient-slots), or 20.2 patient-slots/person (90% CI: 7.99 patient-slots/person-81.2 patient-slots/person) for every living human. Patient-slots are not unique people. They are repeated opportunities to test prevention, combination therapy, diagnostics, dosing, repurposing, platform vaccines, and population-scale protocols across time. The claim is not that the planet contained hundreds of billions of spare patients. The claim is that the defendants had enough money to saturate every practical bottleneck and still have trial capacity left over.
Observed toolchain anchors show the scale problem:
| Toolchain anchor | Observed cost |
|---|---|
| Human Genome Project | |
| NIH CRISPR-related funding, FY2011-FY2018 | |
| BRAIN Initiative planned budget | |
| PCORnet infrastructure funding anchor | |
| HITECH EHR incentive estimate | |
| Operation Warp Speed potential vaccine awards | |
| Observed anchor costs | $58.6 billion |
| Aggressive prosecutor reserve | $20 trillion (95% CI: $5 trillion-$50 trillion) |
The reserve is 341x the observed anchor costs above. This is the point. The pleading theory does not need Nobel-grade precision. It needs to defeat the excuse that the missing tools made the medical counterfactual impossible. The money was large enough to buy the tools, overpay for the tools, build factories for the tools, and then fund the trials.
The standard objection is that conceptual breakthroughs – DNA structure, oncogenes, cellular senescence – cannot be bought. This is wrong. Breakthroughs are proportional to the number of researchers working on a problem, which is proportional to funding. Watson and Crick did not discover DNA in 1953 because it was scheduled for 1953. Operation Warp Speed compressed a 10-15 year vaccine timeline to 9 months. The Human Genome Project’s 15-year timeline was matched in 3 years by a competitor with better incentives. The rate-limiting factor is not human genius; it is how many humans can afford to practice science.
The model assumes prize-based funding, not NIH grants. Prizes pay for results; grants pay for process and generate paper-factory output nobody applies. Prize structures produce roughly 5-10x more useful output per dollar. The 1950 (90% CI: 1922-2020) disease cutoff is therefore conservative.
For the forward-looking version of the same machinery starting now, see 1% Treaty Impact43 44. That chapter estimates what happens if the treaty is adopted today. This section estimates what humanity lost by not doing the obvious version in 1900.
This section is the factual basis for Count Three in Humanity v. Government. The charge is not “every disease death is your fault.” The charge is “you had the money to run the trials and you spent it on missiles instead.” One is a tantrum. The other is arithmetic.
The Grand Total: Everything War Has Cost Since 1900
| Category | Estimate (2024 USD) | Method |
|---|---|---|
| Cumulative military spending | SIPRI + historical reconstruction | |
| Property and infrastructure destruction | Sum of major conflict estimates | |
| Environmental destruction and contamination | Annual estimates x century + catastrophic events | |
| QALY value of lives lost | 310 million deaths x 27 years x $150,000 (90% CI: $100,384-$198,679)/QALY | |
| Compound opportunity cost (lost annual GDP) | $2.55 quadrillion (90% CI: $851 trillion-$7.24 quadrillion)/year | 8 channels stacked, 124 years compounded |
| Historical sunk cost | $1.48 quadrillion (90% CI: $862 trillion-$1.93 quadrillion) | Military + destruction + lives |
| Ongoing annual loss | $2.55 quadrillion (90% CI: $851 trillion-$7.24 quadrillion)/year | Compound growth penalty |
| Per capita impact | 23.2x (90% CI: 8.4x-64x) richer | Every person, everywhere |
Historical tab: $1.48 quadrillion (90% CI: $862 trillion-$1.93 quadrillion). The compound opportunity cost dwarfs it: $2.55 quadrillion (90% CI: $851 trillion-$7.24 quadrillion) in lost annual output, every year, growing.
The average person on Earth would be 23.2x (90% CI: 8.4x-64x) richer. $333,636 (90% CI: $120,624-$921,185)/year instead of $14,375 (90% CI: $14,081-$14,682).
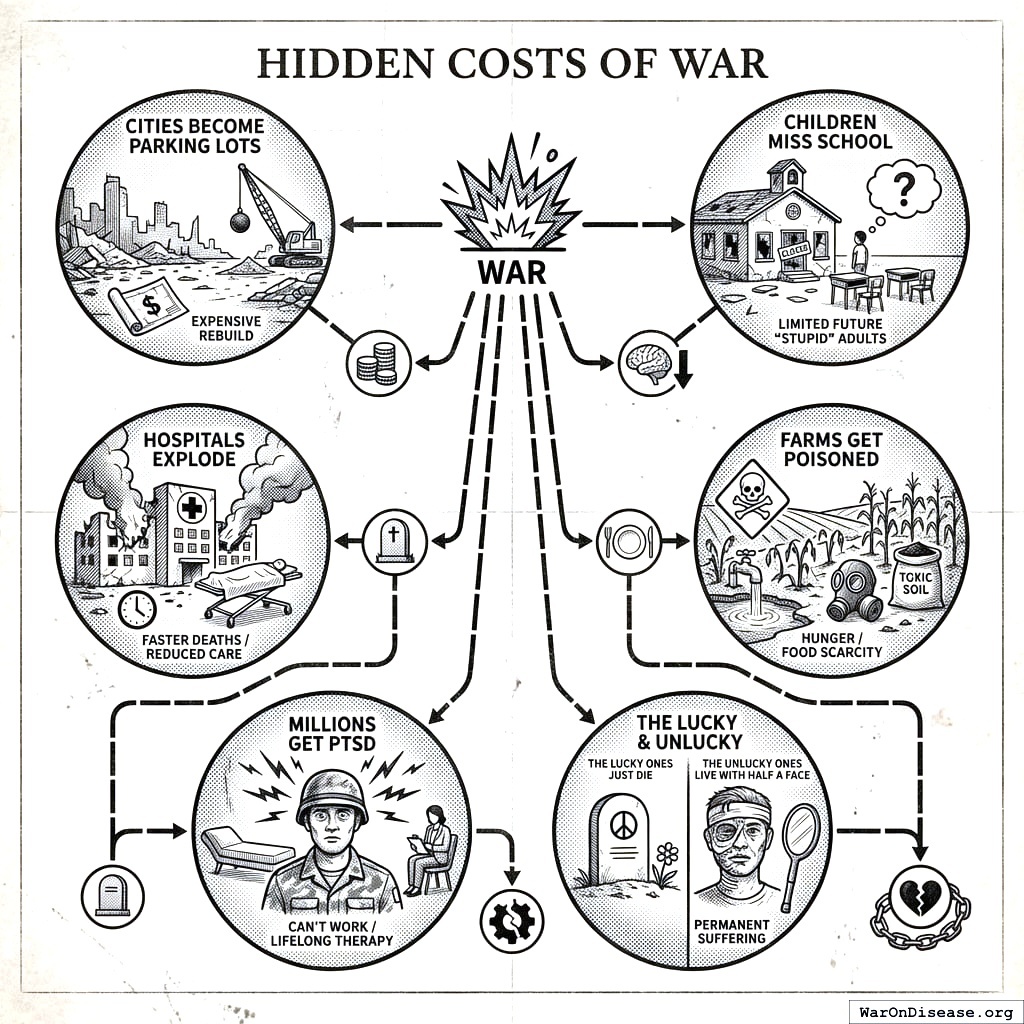
The Other Receipt: When Governments Kill Their Own People
Everything above only counts what governments spend killing other countries’ people. It does not include returns on domestic investment.
Political scientist R.J. Rummel spent his career counting what he called “democide”: the murder of unarmed civilians by their own governments. Not soldiers. Not enemy combatants. Civilians. The people governments are supposed to protect. His final estimate: 262 million people murdered by governments in the 20th century alone35. That excludes all battle deaths in wars. This is just the bonus killing.
To be clear: that is more than every war death in the same century combined.
Here is the itemized receipt, sorted by body count:
| Regime | Period | Estimated Deaths | What Happened |
|---|---|---|---|
| China (Mao Zedong) | 1949-1976 | 45-78 million | Great Leap Forward famine (policy-induced), Cultural Revolution, land reform campaigns |
| Soviet Union (Stalin era) | 1924-1953 | 20+ million | Gulag system, Ukrainian famine (Holodomor), Great Purge, forced collectivization |
| Nazi Germany | 1933-1945 | 21 million | Holocaust (6M Jews), plus Slavs, Roma, disabled, POWs, political prisoners |
| Imperial Japan | 1937-1945 | 6 million | Nanjing massacre, forced labor, biological experiments, civilian massacres across Asia |
| Cambodia (Khmer Rouge) | 1975-1979 | 2 million | “Year Zero” forced agrarian revolution; ~25% of population killed in 4 years |
| Ottoman Empire | 1915-1923 | 1.5-2 million | Armenian Genocide, Assyrian and Greek genocides |
| Pakistan (Bangladesh) | 1971 | 1-3 million | Bangladesh Liberation War atrocities |
| Ethiopia (Mengistu) | 1977-1991 | 1-2 million | Red Terror, forced resettlement, engineered famine |
| Indonesia | 1965-1966 | 500,000-1 million | Anti-communist purge |
| Rwanda | 1994 | 800,000-1 million | Tutsi genocide; 100 days, mostly machetes |
| North Korea | 1948-present | 1-3.5 million | Political prison camps, forced starvation, purges |
| Iraq (Saddam Hussein) | 1979-2003 | 250,000-500,000 | Anfal campaign, Marsh Arab destruction, political killings |
| Yugoslavia (Milosevic) | 1991-1999 | 130,000-200,000 | Srebrenica massacre, ethnic cleansing campaigns |
This table only includes the largest cases. Rummel’s full dataset documents over 200 regimes45. The complete list is longer than this chapter.
Since 2000, the accounting continues: Darfur (~300,000 killed between 2003 and 2008)46, Syria (306,887 civilians killed in the first decade of conflict, with government forces responsible for roughly 91% of civilian casualties)47, Myanmar’s Rohingya (~24,000 killed by state forces since 2017)48, and others. No Rummel-style global update exists for the 21st century, but the running total since 1913 conservatively exceeds 263 million.3
A few observations from an outside perspective:
- Communist regimes account for the largest share: 100-148+ million, depending on how you count famine deaths caused by policy. Communism did not just fail as economics. It failed as not-murder.
- These are estimates. Governments that murder their own citizens tend not to keep meticulous records. In many cases, the records were destroyed by the same people who created the bodies. The true number is almost certainly higher.
- Every regime on this list had an army. The army was frequently the instrument of democide. You are instructing these institutions to redirect 1% of their budget. One percent. From the machinery they have historically used to murder 262 million of their own unarmed citizens.
The governments you are trying to negotiate with have, on average, killed more of their own people than foreign enemies have. The call is coming from inside the house. It has always been coming from inside the house.
This is not an argument against government. It is an argument for better incentive structures. The 1% treaty44 does not ask governments to be moral. It directs them to be slightly less expensive at killing. The difference between a government that spends 100% of its military budget on potential murder and one that spends 99% is $27.2 billion per year redirected to not-murder. That is the entire instruction.
This estimate is built from multiple sources. SIPRI data from 1988-2024 sums to approximately $65-72 trillion in constant dollars3,6. The Cold War era (1946-1987) adds roughly $50-70 trillion, reconstructed from US spending data (the US accounted for ~37-40% of global totals) and CIA estimates of Soviet expenditure. World War II cost all belligerents approximately $23 trillion in 2024 dollars33, World War I approximately $7 trillion, with another $3-5 trillion for interwar military budgets. The 19th century adds roughly $3 trillion (Napoleonic Wars, American Civil War, colonial conflicts, routine garrison spending). Pre-1800 military spending, estimated via GDP-share equivalence using Maddison Project historical GDP data, adds $4-20 trillion with enormous uncertainty; the Roman Empire alone spent an estimated $1-2 trillion over five centuries. The range is $150-225 trillion; $180 trillion is the central estimate. Roughly 75% of the total was spent after 1945, because global GDP grew 100-fold since 1900 while military burdens stayed at 2-5% of output.↩︎
Built from non-overlapping categories: Rummel’s democide estimate of 264M (government murder of civilians, 1900-present, which explicitly excludes battle deaths35) + 39M military battle deaths + 30M collateral civilian war deaths2,36 - ~25M overlap adjustment (some civilian massacres counted by both Rummel and war casualty tallies) = ~310M. Range: 200M (White’s narrow definition) to 340M (Rummel high + all military).↩︎
Post-Rummel table entries (North Korea post-1987, Iraq, Yugoslavia) draw on Human Rights Watch, UN tribunal findings, and country-specific academic estimates rather than Rummel’s dataset, which ended circa 1987.↩︎