How Much Does It Cost to Buy All the Governments?
What is the maximum cost to achieve any policy change through legal democratic channels? We estimate $25 billion for the United States and $200 billion globally. These figures represent the upper bound of matching all opposition spending (campaign finance, lobbying) and providing career alternatives for affected legislators. For high net-societal-value policies, even these maximum costs yield extraordinary returns: military-to-health reallocation achieves a benefit-cost ratio in the tens of thousands to one, carbon pricing exceeds 1,000:1, and occupational licensing reform exceeds 2,000:1. The “political impossibility” objection thus reduces to a capital allocation problem. Political change is not impossible; it is merely expensive, and for valuable reforms, the price is trivial relative to the benefits. At system scale, the Optimal Governance Trajectory reaches 56.7x (90% CI: 21x-148x) the Earth baseline after 20 years, raises average income to $1.16 million (90% CI: $429,664-$3.04 million) versus $20,483 on the status-quo path, reaches $10.7 quadrillion (90% CI: $3.95 quadrillion-$28 quadrillion) in total output, and recovers roughly $101 trillion (90% CI: $59.6 trillion-$161 trillion)/year in suppressed value (The Political Dysfunction Tax).
political economy, public choice, collective action, campaign finance, lobbying, rent-seeking, cost-benefit analysis, policy reform, mechanism design
Introduction
The Political Impossibility Objection
Every good idea in public policy eventually meets the same six words: “That will never happen politically.” This is treated as a conversation-ender, like a law of physics. Gravity pulls things down. Politicians serve donors. Nothing to be done.
This paper points out that “politically impossible” is not a law of physics. It is a price tag. Everything politicians do, they do because someone made it worth their while. The question is not whether change is possible, but how much it costs, and whether the benefits exceed the price.
The objection is applied to carbon pricing1, agricultural subsidy reform2, occupational licensing reform3, military spending reallocation, and numerous other high-value policy changes. Lobbying exists because it works. Campaign contributions correlate with legislative outcomes4. If incentives affect political outcomes, then political change has a price. We formalize this as:
\[ \text{Political Change is Rational if: } \quad C(p) < B(p) \times P(s|C) \]
Where \(C(p)\) is the cost of achieving policy \(p\), \(B(p)\) is the benefit if successful, and \(P(s|C)\) is the probability of success given investment \(C\).
What This Paper Does
Framework: A general model for estimating political reform investment costs, decomposed into campaign finance, lobbying, and career value components. (How much does a senator cost? Not as much as you’d think.)
Empirical estimates: Upper-bound estimates for US and global political systems, establishing that even maximum democratic engagement scenarios have quantifiable costs. (The answer for the US: about $25 billion. For the whole world: about $200 billion. This sounds like a lot until you compare it to the benefits.)
Case studies: Multiple policy domains, demonstrating that high-NSV reforms yield positive expected value even under pessimistic assumptions about political costs. (Military-to-health reallocation: a benefit-cost ratio in the tens of thousands to one. The worst investment on this list still returns 1,000:1.)
Scale note. The benefit side that this paper is pricing is enormous. Under the project’s best-case governance ceiling, the recoverable upside is $101 trillion (90% CI: $59.6 trillion-$161 trillion) per year. Over 20 years, the Optimal Governance Trajectory reaches 56.7x (90% CI: 21x-148x) the Earth baseline, raises average income to $1.16 million (90% CI: $429,664-$3.04 million) versus $20,483 on the status-quo path, and reaches $10.7 quadrillion (90% CI: $3.95 quadrillion-$28 quadrillion) in total output. This paper focuses on the cost of getting there through democratic incentives and capital deployment; the full upside derivation lives in The Political Dysfunction Tax5.
Literature Review
The public choice tradition6,7 models political actors as rational agents responding to incentives. Olson8 demonstrated that groups with concentrated benefits systematically outcompete larger groups with diffuse benefits, explaining why small industries successfully defend subsidies imposing large aggregate costs on consumers.
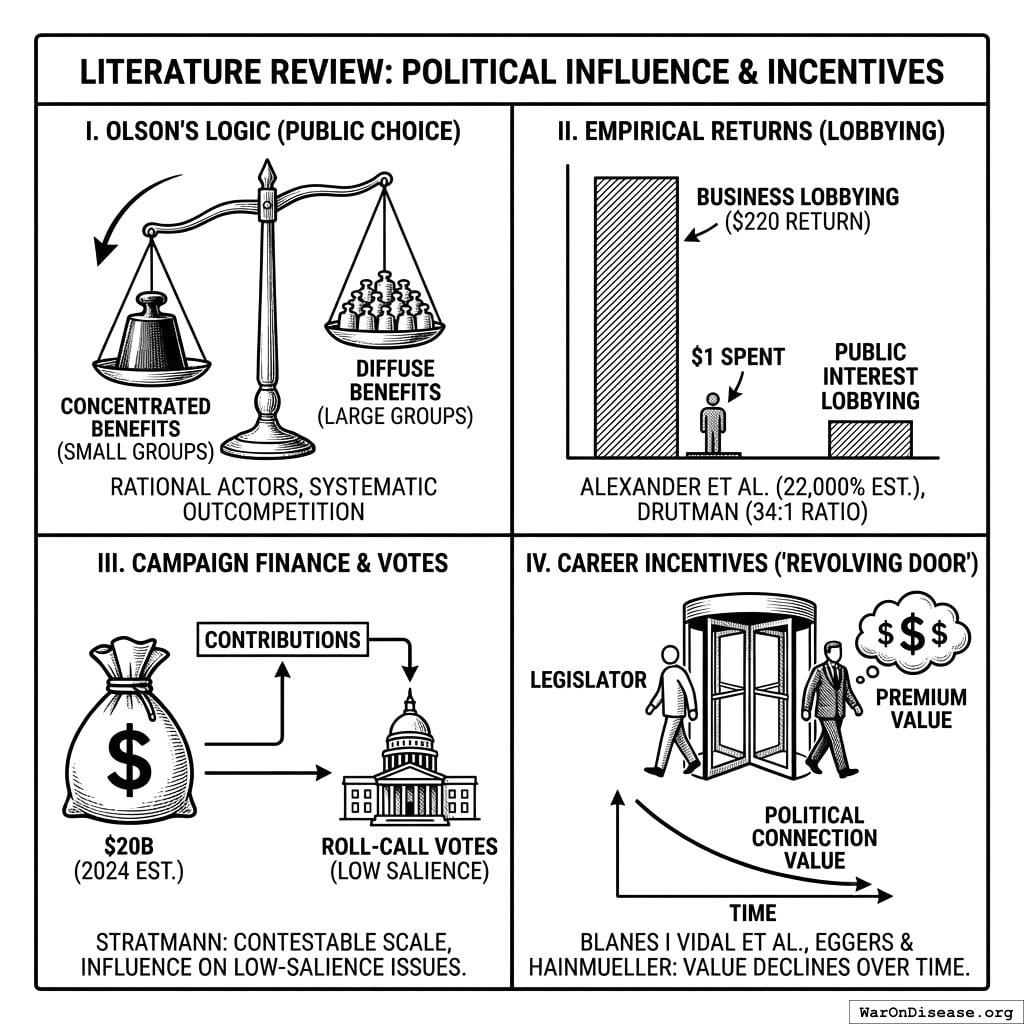
The empirical literature establishes that political investment produces returns.9 estimated returns to lobbying for the American Jobs Creation Act at 22,000% ($220 in tax benefits per $1 spent).10 documents business-to-public-interest lobbying ratios exceeding 34:1, suggesting sophisticated actors believe lobbying works.
Campaign finance operates at contestable scale: total US federal election spending in 2024 was $20 billion (95% CI: $18 billion-$22 billion).11 finds contributions influence roll-call votes, particularly on low-salience issues.
Beyond direct spending, legislators respond to career incentives.12 documents the “revolving door” value: former senators who become lobbyists earn substantial premiums, with political connection value declining over time.13 finds similar patterns internationally. These career incentives are typically omitted from political feasibility analyses.
Theoretical Framework
The Political Cost Function
We model the cost of achieving policy change \(p\) as a function of four components:
\[ C(p) = C_{campaign}(p) + C_{lobby}(p) + C_{career}(p) + C_{coord}(p) \]
Where:
- \(C_{campaign}(p)\) = Campaign finance required to elect supportive legislators or match opposition spending
- \(C_{lobby}(p)\) = Lobbying expenditure required to inform and persuade legislators
- \(C_{career}(p)\) = Compensation for legislators’ foregone post-office career value
- \(C_{coord}(p)\) = Coordination costs among diffuse beneficiaries
Each component can be estimated empirically, providing an upper bound on political reform investment costs.
Campaign Finance Component
For policy requiring support from \(n\) legislators, campaign costs can be bounded by:
\[ C_{campaign}(p) \leq k \times S_{total} \]
Where \(S_{total}\) is total spending in affected elections and \(k\) is a multiplier reflecting the share of spending required to achieve electoral influence. In the limit, \(k = 2\) represents outspending all existing political spending 2:1.
Lobbying Component
Lobbying costs can be bounded by:
\[ C_{lobby}(p) \leq m \times L_{total} \times T \]
Where \(L_{total}\) is annual lobbying expenditure, \(m\) is a dominance multiplier, and \(T\) is the time horizon. Setting \(m = 2\) and \(T = 4\) years provides a conservative upper bound.
Career Value Component
The career component compensates legislators for foregone post-office opportunities:
\[ C_{career}(p) = \sum_{i=1}^{n} V_i \]
Where \(V_i\) is the net present value of legislator \(i\)’s expected post-office career premium. This can be estimated from revolving-door salary data.
The Benefit Function
Policy benefits depend on the net societal value (NSV) created:
\[ B(p) = \sum_{t=0}^{T} \frac{NSV_t}{(1+r)^t} \]
Where \(NSV_t\) is net societal value in year \(t\), \(r\) is the discount rate, and \(T\) is the time horizon.
Breakeven Condition
Political incentivization is economically rational when:
\[ \frac{B(p)}{C(p)} > 1 \]
We will show that for high-NSV policies, this ratio typically exceeds 1,000:1 even under pessimistic cost assumptions.
Empirical Methodology
US Political System Cost Estimates
We estimate political capture costs for the United States using publicly available data.
Campaign Finance
Total US federal election spending in the 2024 cycle:
| Category | Amount | Source |
|---|---|---|
| Presidential candidates | $2.0B | FEC14 |
| House & Senate candidates | $3.8B | FEC14 |
| Political party committees | $2.7B | FEC14 |
| PACs and Super PACs | $15.7B | FEC14 |
| Total | $20 billion (95% CI: $18 billion-$22 billion) | Combined |
Lobbying
Total US lobbying expenditure in 2024: $4.4 billion (95% CI: $3.74 billion-$5.06 billion)
Top sectors include pharmaceuticals ($387M), finance/insurance ($582M), and military ($149M).
Post-Office Career Value
Based on revolving-door data15,16:
| Position | Congressional Salary | Typical Post-Office | Premium |
|---|---|---|---|
| Representative | $174K | $500K-$2M | 3-11x |
| Senator | $174K | $1M-$3M | 6-17x |
| High-profile members | $174K | $2M-$7M | 11-40x |
Assuming 10-year post-office careers and ~$1M/year average premium, the NPV per legislator is approximately $10 million (95% CI: $5 million-$20 million).
US Maximum Reform Investment Scenarios
These scenarios represent upper-bound costs to achieve democratic parity with incumbent interests: matching their political spending and providing alternative career paths for legislators.
| Scenario | Components | Cost |
|---|---|---|
| Match military industry 2:1 | Military lobby + contributions × 2 | $360M/year |
| Match ALL lobbying | Total lobbying × 1.5 | $6.6B/year |
| Match all campaign spending | Federal elections × 1 | $10B/cycle |
| Match 67 senators’ career incentives | 67 senators $10 million (95% CI: $5 million-$20 million) NPV | $670M one-time |
| Match full Congress career incentives | 535 members $10 million (95% CI: $5 million-$20 million) NPV | $5.35 billion one-time |
| Total US reform investment | All components | $25.5 billion (90% CI: $17.5 billion-$36.3 billion) |
Global Estimates
We estimate global costs by scaling from the US, which has the most transparent and well-documented political spending data:
| Component | Value | Notes |
|---|---|---|
| US reform investment | Calculated from components above | |
| Global-to-US ratio | 5.0 (95% CI: 3.0-8.0) | US is ~40% of military spending but has uniquely expensive politics |
| Global total | $128 billion (90% CI: $71.7 billion-$206 billion) | US × ratio |
The ratio reflects that global discretionary government spending is roughly 9x US discretionary spending (~$15T vs ~$1.7T), discounted by ~50% because non-US political systems tend to be less transparent and potentially less expensive to influence. The wide confidence interval reflects uncertainty about non-US political dynamics and hidden influence channels.
Uncertainty Analysis
These estimates are calculated from input parameters with explicit uncertainty distributions. Monte Carlo simulation propagates uncertainty through the calculation chain.
Input parameters with uncertainty:
| Parameter | Point Estimate | 95% CI | Description |
|---|---|---|---|
| US campaign spending | ±10% | FEC 2024 data | |
| US lobbying (annual) | ±15% | OpenSecrets 2024 | |
| Post-office career value | $5M-$20M | Revolving door data | |
| Political effort multiplier | 0.7 | 0.4-1.2 | Fraction of spending to match |
| Global-to-US ratio | 5.0 | 3.0-8.0 | Rest-of-world scaling |
Calculated outputs (uncertainty propagated):
| Output | Formula | Result |
|---|---|---|
| US reform investment | (Campaign + Lobbying×2) × Effort + Career | |
| Global reform investment | US × Global ratio |
Key sources of uncertainty:
- Hidden spending channels: Dark money, unreported lobbying, and informal influence networks may exceed reported figures by 20-50%
- Counter-spending dynamics: Opponents may escalate spending, though they face budget constraints (cannot spend more than their rents)
- Non-linear effects: Political influence may not scale linearly with spending; threshold effects and diminishing returns likely exist
- Cross-country variation: Political systems differ dramatically in their susceptibility to organized influence
Despite this uncertainty, the core conclusion is robust: even at the 95th percentile of $128 billion (90% CI: $71.7 billion-$206 billion), high-NSV policies yield a benefit-cost ratio in the tens of thousands to one.
Implications for Major Health Funders
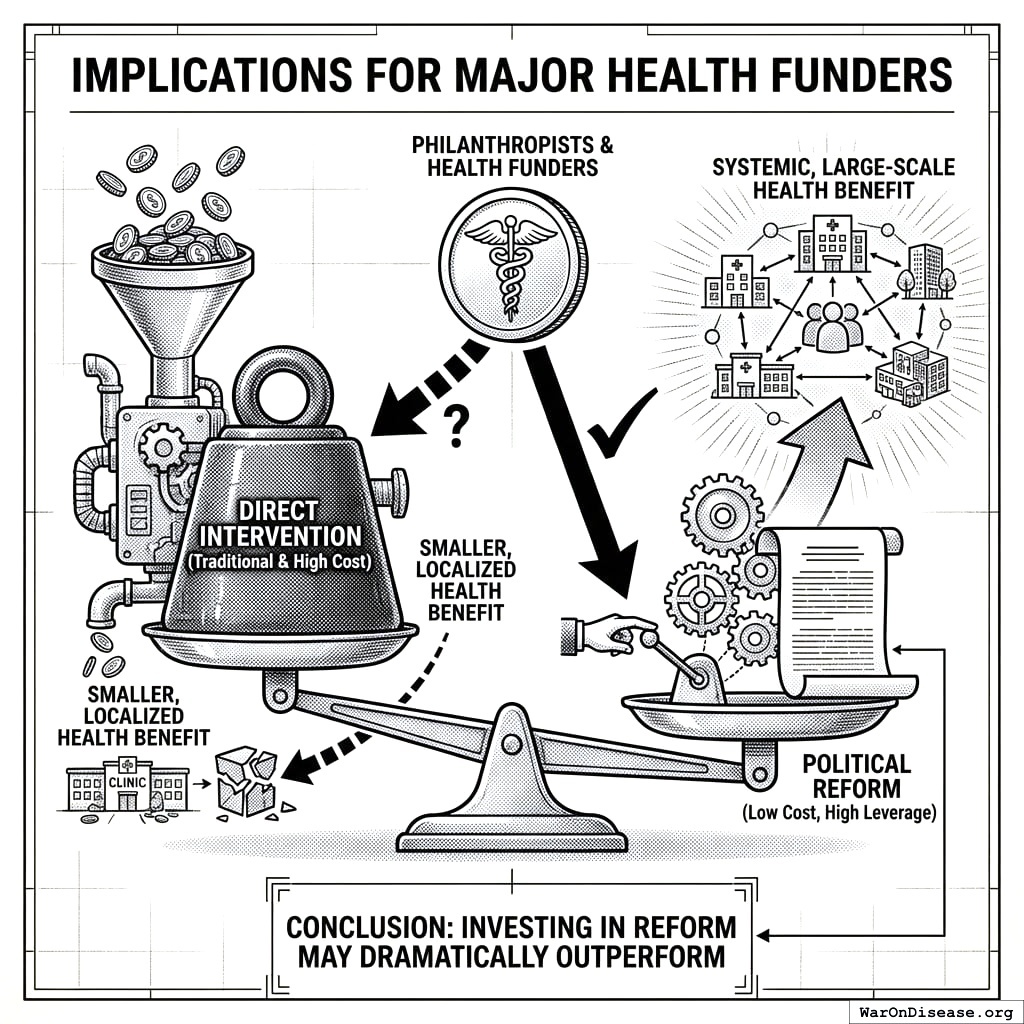
The cost estimates above have profound implications for philanthropists and health funders. If political reform is tractable at these costs, and the potential benefits are as large as documented, then investing in political reform may dramatically outperform direct intervention.
Current Philanthropic Efficiency
The Gates Foundation, the world’s largest private foundation, spends approximately $7.7 billion annually17. At roughly $50-100 per DALY averted (competitive with GiveWell’s best interventions), this generates approximately 70-140 million DALYs averted per year.
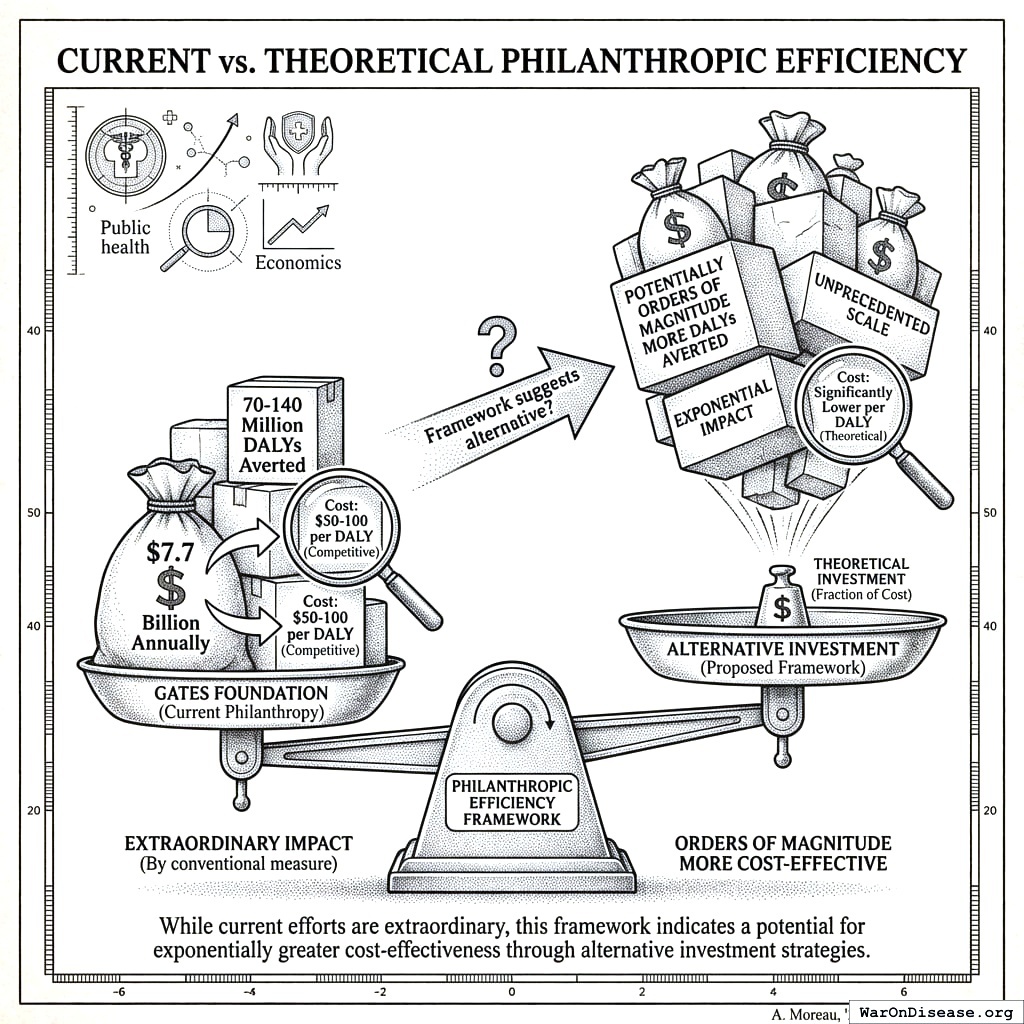
This is extraordinary philanthropy by any conventional measure. But the framework above suggests an alternative investment that may be orders of magnitude more cost-effective.
The Political Reform Benefit-Cost Calculation
Consider a hypothetical $25 billion investment in political reform (the maximum US reform investment estimated above):
| Variable | Conservative Estimate |
|---|---|
| Investment | $25B |
| Probability of success | 5% |
| If successful: Annual value recovered | $100B/year |
| Time horizon | 20 years |
| Expected present value | $100B × 20 × 5% = $100B |
| Net expected value | $100B - $25B = $75B |
| Expected DALYs at $75/DALY | 1 billion DALYs |
Even at a pessimistic 5% success probability, the expected value is $75 billion, equivalent to 1 billion DALYs. This is approximately 10-15x more cost-effective than the Gates Foundation’s current giving per dollar invested.
Who Can Afford What
| Investment Tier | Cost | Who Can Afford | What It Buys |
|---|---|---|---|
| Pilot | $10-50M | Most major foundations, tech billionaires | Proof of concept, initial Incentive Alignment Bond (IAB) deployment |
| Scaling | $100M-1B | Gates, Wellcome, Bloomberg, Open Philanthropy | Multi-state campaign, serious political pressure |
| Full reform | $25B | Coalition of billionaires, or single mega-donor | Complete US political system engagement |
Individual capacity for full reform ($25B): Several individuals could fund complete US political reform unilaterally:
| Individual | Net Worth | $25B as % of Wealth | Could Fund Solo? |
|---|---|---|---|
| Elon Musk | ~$400B | 6% | Yes |
| Jeff Bezos | ~$230B | 11% | Yes |
| Mark Zuckerberg | ~$220B | 11% | Yes |
| Larry Ellison | ~$200B | 13% | Yes |
| Bill Gates | ~$130B | 19% | Yes |
| Warren Buffett | ~$140B | 18% | Yes |
| MacKenzie Scott | ~$35B | 71% | Stretch |
Any 3-5 of these people could fund complete political reform and still be richer than everyone they have ever met. The question is not whether they can afford it.
Benefit-Cost Comparison
| Approach | Investment | Cost per DALY | Expected DALYs |
|---|---|---|---|
| Gates direct interventions | $7B/year | ~$75 | 93M/year |
| Political reform ($25B @ 5% success) | $25B one-time | ~$0.025 | 1B+ expected |
| Cost-effectiveness ratio | ~3,000x |
Why This Is Rational for Funders
- Asymmetric payoffs. Success is worth trillions. Failure costs billions. The ratio is not close.
- Nobody else is doing it. Political reform gets almost nothing relative to its expected value. The marginal dollar here is worth thousands of marginal dollars elsewhere.
- $1 redirects $1,000. Unlike direct intervention (where $1 buys $1 of service), political reform redirects $1,000+ of government spending. That is not “leverage.” That is the difference between buying one bandage and fixing the factory that makes bandages.
- Same goal, better route. Major health funders already want to maximize health outcomes. This is the same destination, except you take the highway instead of crawling through a ditch.
For detailed analysis of the political economy and implementation mechanisms, see Optimocracy: Evidence-Based Governance18.
Case Study: Military-to-Pragmatic Clinical Trial Reallocation (1% Treaty)
Policy: Redirect 1% of global military spending (~$27.2 billion/year) to medical research through pragmatic clinical trials.
Counterfactual: At current discovery rates (~15 new disease treatments annually), exploring treatments for all ~6,650 diseases lacking FDA-approved therapies would take 443 years. The treaty accelerates this timeline by 212 years on average, bringing treatments forward by that duration. Benefits below represent cumulative lives saved and suffering eliminated over this acceleration period, compared to the status quo timeline.
Estimated Benefits (cumulative over 212-year acceleration):
| Category | Value |
|---|---|
| Lives saved | 10.7 billion deaths (90% CI: 6.24 billion deaths-20.3 billion deaths) |
| DALYs averted | 565 billion DALYs (90% CI: 309 billion DALYs-1.08 trillion DALYs) |
Political Reform Investment: $25.5 billion (90% CI: $17.5 billion-$36.3 billion) (US) to $128 billion (90% CI: $71.7 billion-$206 billion) (global)
Benefit-Cost Calculation:
| Political Investment | Benefit-Cost Ratio | Cost per DALY |
|---|---|---|
| $1 billion (realistic) | 7.53 million (90% CI: 2.96 million-15.1 million):1 |
Even at the full $128 billion (90% CI: $71.7 billion-$206 billion) global political cost, the benefits ($7.53 quadrillion (90% CI: $3.08 quadrillion-$12.8 quadrillion), discounted) exceed the cost tens of thousands of times over, and the cost per DALY stays far below bed nets ($184 (90% CI: $113-$252)).
Other Policy Domains
The same framework applies to other high-value policy reforms. Brief analysis suggests:
- Carbon pricing ($4B political cost vs. $5T+ avoided damages): ROI ~1,250:1
- Agricultural subsidy reform ($1B vs. $60B deadweight loss over 4 years): ROI ~60:1
- Occupational licensing reform ($1B vs. $2T consumer savings over 10 years): ROI ~2,000:1
These estimates use the same methodology: match opposition spending 2-3:1, account for career value, and compare to policy benefits. In all cases, even pessimistic political cost estimates yield strongly positive expected value.
Limitations
Legal constraints: Our framework assumes legal channels only (campaign contributions, lobbying, independent expenditures, career opportunities). Direct payments constitute bribery. The multi-billion-dollar lobbying industry demonstrates legal channels produce real effects.
Counter-spending dynamics: Affected interests may escalate spending in response. However, industries already spend near optimal levels and cannot exceed their total rents. See Uncertainty Analysis for quantified ranges.
Political backlash: Visible attempts to influence outcomes may generate voter backlash. Mitigation requires framing as education and advocacy, decentralized voter organizing, and transparency.
Implementation complexity: Coordinating spending across campaigns, lobbying, and career incentives requires sophisticated organizational capacity that may not exist among diffuse beneficiaries.
Conclusion
The “political impossibility” objection to policy reform dissolves under quantitative scrutiny. We have shown that:
Political change has a quantifiable cost composed of campaign finance, lobbying, and career value components that can be estimated from public data.
Even maximum engagement scenarios are bounded: achieving full democratic parity in the US costs $25.5 billion (90% CI: $17.5 billion-$36.3 billion); global parity costs $128 billion (90% CI: $71.7 billion-$206 billion).
High-NSV policies yield extreme benefit-cost ratios: for policies like military-to-health reallocation, the benefit-cost ratio stays in the tens of thousands to one even at maximum political investment.
The breakeven point is astronomical: political investment costs would need to exceed trillions of dollars before high-value reforms become uneconomical.
These findings have implications for philanthropists, impact investors, and reform advocates. The expected value of political engagement dramatically exceeds the expected value of working within existing political constraints, even accounting for substantial probability of failure.
The question is not whether political change is possible. The military industry, pharmaceutical companies, and financial institutions demonstrate daily that political investment produces returns. The question is whether those seeking to improve collective welfare will make comparable investments.
The political impossibility objection is itself the obstacle: by accepting it, potential reformers decline to compete. Our analysis suggests this concession is economically irrational.